Plots
This section shows some of the common plots used in the propeller acoustics simulation. The steps to create the plots are:
Ffowcs-Williams Hawkings (FWH) (Transient) Model
The steps to create the plots in the FWH model are:
- Click Load Results in the Simulation Panel.
- Select the required result file in the ensuing Load Results dialog box, click Open.
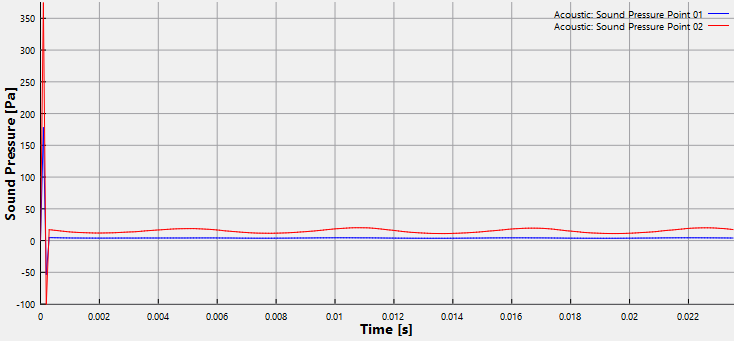
Sound Pressure
The transient simulation with FWH Model outputs the sound pressure that is activated on the monitoring points. Hence a plot of the sound pressure on the points is monitored.
- Select Point 01 and Point 02 under Points in the Geometric Entities Panel.
- Click Add XY-Plot
 icon in the Toolbar.
 - Click Click for Variable List
 icon and select Sound Pressure under Acoustic list in the Plot Panel.
 - Click Plot Selected Variables
 icon in the Plot Panel.