11.16.5 Simulation
This section explain the settings to run the FWH source model. The steady result of Broadband model is used as an initial solution for the transient simulation using FWH model.
Create Monitoring Points
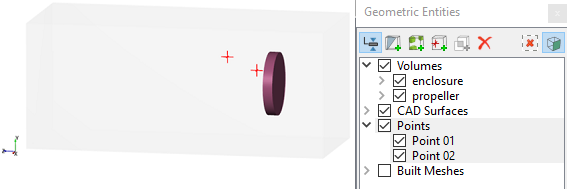
In the FWH model simulation, the sound pressure variation in the flow domain is of interest. Hence, monitoring points are created around the propeller to predict the sound pressure. The steps to create the monitoring points are as follows:
- On the Geometric Entities Panel toolbar, click twice Create a Monitoring Point
 , to create Points Point 01 and Point 02.
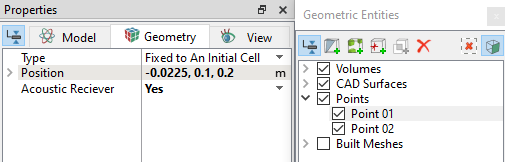
 - Select each point in the Geometric Entities Panel and specify their Position values as shown in in the Geometry Tab of Properties Panel refer, Figure 11.380
- Select Yes from the Acoustic receiver drop-down list in the Geometry Tab of Properties Panel. This outputs the sound pressure on the specified point.
| Points | Position values |
|---|---|
| Point 01 | -0.0225, 0.1, 0.2 |
| Point 02 | -0.0125, 0.05, 0.075 |
Table 11.15 - Monitoring points
|
Note: Monitoring points need to be created before running the simulation for recording data refer, Figure 11.381. The position of a Points may also be dragged to a new location using the Select |
FWH Model (Transient) Simulation Settings
|
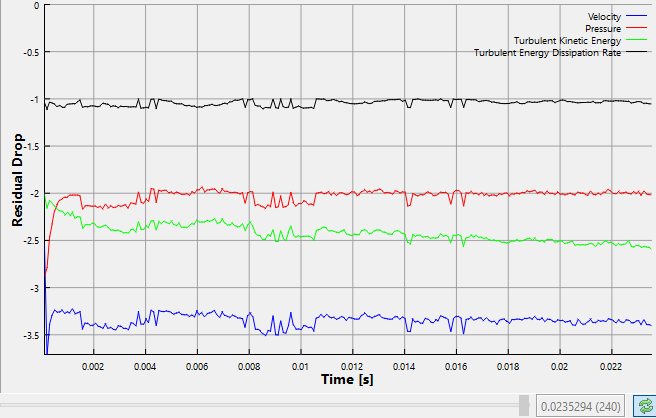
The residuals for the transient simulation are displayed under the Residual Tab in the Plot Panel as shown in Figure 11.384.
|
|
| Note: The Result Saving Frequency option in the Simulation Panel is set to a small value (say 5 or 10) before running the simulation to obtain better animations. |