|
You are here: Automotive Templates and Tutorials > Automotive Tutorials > Coolant Filling System Tutorial > Plots
|
Plots
This section shows how to plot the results from the coolant filling system simulation, such as total coolant volume filled in the system including or excluding tank volume as shown in the plots below. The steps to create the plots are:
- Click Load Results in the Simulation Panel.
- Select the required result file "(coolant_filling_pump_on_fill_47000.sres)" in the ensuing Load Results dialog box, click Open.
Inflow
The coolant inflow through inlet is monitored with the plot created using expressions
- Click Add XY-Plot
 icon in the Toolbar.
 - Select Common in the Model Panel.
- Click Click for Variable List
 icon in the Plot Panel toolbar.
 - Select flow_in under Common and click Plot Selected Variables
 icon.
icon.
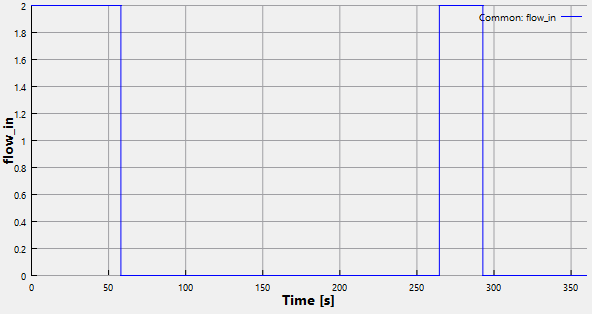
Figure 7.301 - Inflow in L/min
Total coolant volume
The total coolant volume in the system including tank is monitored as the simulation progresses. The plot below shows total coolant volume filled with gravity and pump-on filling of the coolant system.
- Select all Volumes in the Geometric Entities Panel.
- Click Add XY-Plot icon in the Toolbar.
- Click Click for Variable List icon in the Plot Panel toolbar, select Volume from Component coolant list.
- Click Combine Entity Data into a Single Curve
 icon.
icon.
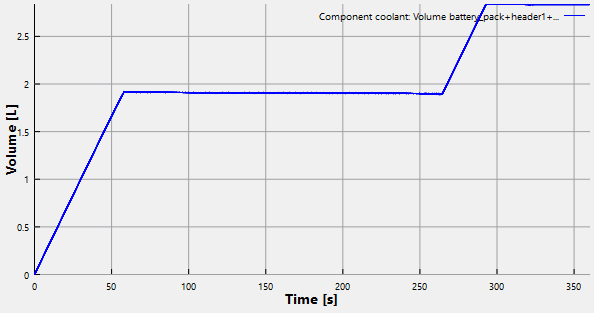
Figure 7.302 - Total coolant volume
Coolant volume (excluding tank)
The coolant volume excluding tank is monitored as simulation progresses. The plot below shows coolant volume filled with gravity and pump-on filling of the coolant system.
- Select all Volumes, except tank in the Geometric Entities Panel.
- Click Add XY-Plot icon in the Toolbar.
- Click Click for Variable List icon in the Plot Panel toolbar, select Volume from Component coolant list.
- Click Combine Entity Data into a Single Curve icon.
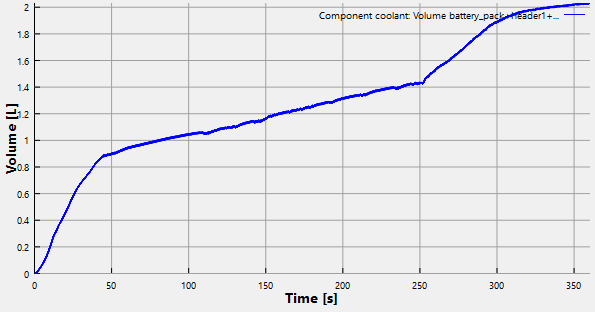
Figure 7.303 - Coolant volume excluding tank
| ´ | Note: The above plot shows Volume Fraction of coolant in the system excluding tank. As time increases, the coolant filling efficiency increases up to 94.8% at the end of 360 s. |