|
You are here: Automotive Templates and Tutorials > Automotive Tutorials > Piston Cooling Tutorial > Plots
|
Plots
This section shows some of the common plots used in the piston cooling simulation. The steps to create the plots are:
Fluid Model
The steps to create the plots in fluid model are:
- Click Load Results in the Simulation Panel.
- Select the result file piston_fluid_5760.sres in the ensuing Load Results dialog box, click Open.
Volume Fraction
The volume fraction is monitored with the volume fraction plots.
- Select gallery under Volumes in the Geometric Entities Panel.
- Click Add XY-Plot
 icon in the Toolbar.
 - Click Click for Variable List
 icon, select Volume Fraction under Component oil in the Plot Panel.
 - Click Plot Selected Variables
 icon > click Plot Property
  icon.
icon. - In the Plot Property dialog box, enable Moving Average and enter 720.
- Specify 0.45 for Maximum and 0.35 for Minimum under Display Default Range. Click OK.
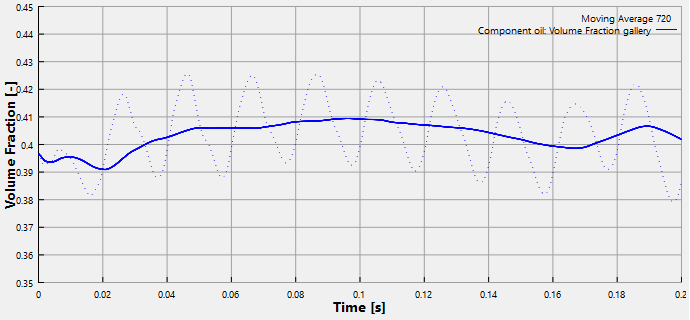
Figure 7.260 - Volume Fraction
Total Heat Flux
The total heat flux taken by the fluid from the solid is obtained as follows:
- Select gallery_wall and piston_fluid_wall under Boundaries in the Geometric Entities Panel.
- Click Add XY-Plot icon in the Toolbar.
- Click Click for Variable List
 icon in the Plot Panel toolbar, select Total Flux in the MulticomponentHeat list.
 - Click Combine Entity Data into a Single Curve
 icon in the Plot Panel toolbar to obtain the net heat flux through the Boundaries.
 - Click Plot Property icon. In the Plot Property dialog box, enable Moving Average and enter 720.
- Specify 0 W for Maximum and -12000 W for Minimum under Display Default Range. Click OK.
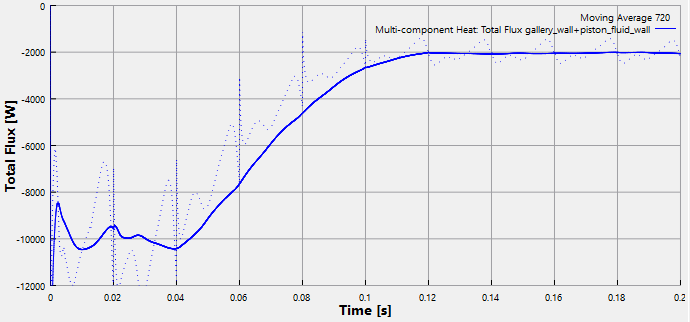
Figure 7.261 - Total Heat flux
| ´ | Note: The above plot shows the heat flux that is mapped from fluid model to the solid model. |
Solid Model
The steps to create the plots in Solid model are:
- Click Load Results in the Simulation Panel.
- Select the result file piston_solid.sres in the ensuing Load Results dialog box, click Open.
Total Heat Flux
The total heat flux taken by the fluid from the solid is obtained as follows:
- Select piston_underside under Boundaries in the Geometric Entities Panel.
- Click Add XY-Plot icon in the Toolbar.
- Click Click for Variable List icon in the Plot Panel toolbar, select Total Flux in theHeat list.
- Click Plot Selected Variables icon in the Plot Panel toolbar.
- Click Plot Property icon. In the Plot Property dialog box, specify 4000 W for Maximum and -1500 W for Minimum under Display Default Range. Click OK.
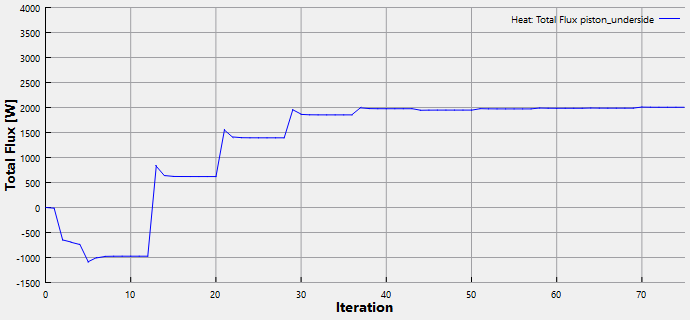
Figure 7.262 - Total Heat flux
Temperature
The temperature is plotted at the monitoring points as follows:
- Select crown_center, topland_inletside and topland_outletside under Points in the Geometric Entities Panel.
- Click Add XY-Plot icon in the Toolbar.
- Click Click for Variable List icon in the Plot Panel toolbar, select Temperature in the Heat list.
- Click Plot Selected Variables icon in the Plot Panel toolbar.
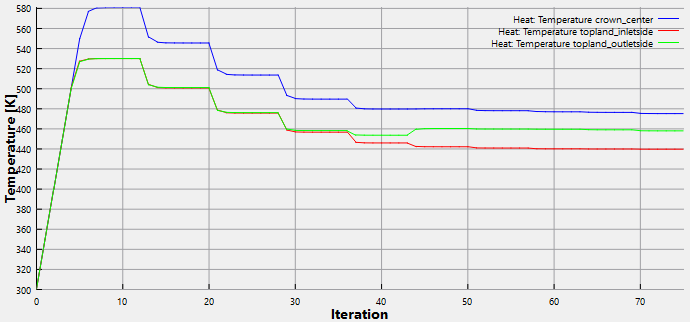
Figure 7.263 - Temperature