Plots
This section shows some of the common plots used in the Ball 3D valve simulation. The steps to create the plots are:
- Click Load Results in the Simulation Panel.
- Select the result file ball3Dvalve_model_1000.sres in the ensuing Load Results dialog box, click Open.
Mass Flux
The mass balance is monitored with the mass flux plots.
- Select inlet_inlet and outlet_outlet under Boundaries in the Geometric Entities Panel.
- Click Add XY-Plot
 icon in the Toolbar.
 - Click Click for Variable List
 icon, select Mass Flux from the Flow list in the Plot Panel.
 - Select Plot Selected Variables
 icon > click Plot Property
  icon.
icon. - In the Plot Property dialog box, specify 0.2 kg/s for Maximum and -0.2 kg/s for Minimum under Display Default Range. Click OK.
- Click Combine Entity Data into a Single Curve
 to obtain the net mass flux.
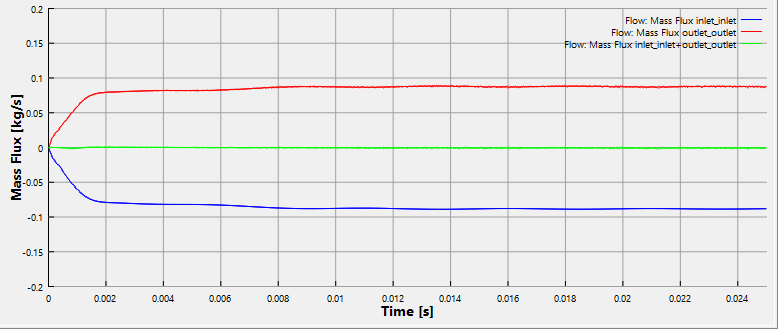
Figure 6.665 - Mass flux plots
|
Note: The moving average is used in transient simulations to obtain the average values of a variable in a sampling interval, over the entire simulation time.To plot the moving average, click Click for Variable List |
Valve Displacement
To plot the angular displacement of the valve in three directions.
- Click Add XY-Plot icon in the Toolbar.
- Select Translation (1 DOF) Ball_main in the Model Panel.
- Click Click for Variable List icon in the Plot Panel, select Displacement from the Translation (1 DOF) Ball_main list.
- Click Plot Selected Variables icon.
-
Similarly, plot the displacement in second and third directions by selecting Translation (1 DOF) Ball_second and Translation (1 DOF) Ball_third respectively in the Model Panel.
- Click Plot Property icon. In the Plot Property dialog box, specify 0.0005 m for Maximum and -0.0002 m for Minimum under Display Default Range. Click OK.
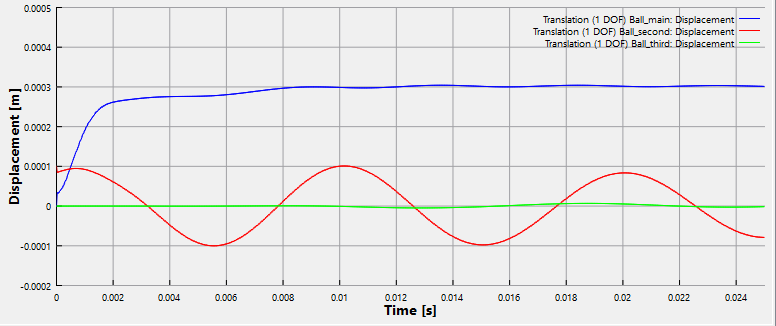
Figure 6.666 - Valve Displacement plot
| ´ | Note: The oscillation of the ball valve in the second direction is due to the initial displacement of 0.0001 m provided in that direction. |
Pressure
The pressure is plotted at the monitoring points as follows:
- Select highpressure_point and lowpressure_point under Points in the Geometric Entities Panel.
- Click Add XY-Plot icon in the Toolbar.
- Click Click for Variable List icon in the Plot Panel, select Pressure from the Flow list.
- Click Plot Selected Variables icon.
- Click Plot Property icon. In the Plot Property dialog box, specify 2.1e+6 Pa for Maximum and 1.68e+6 Pa for Minimum under Display Default Range. Click OK.
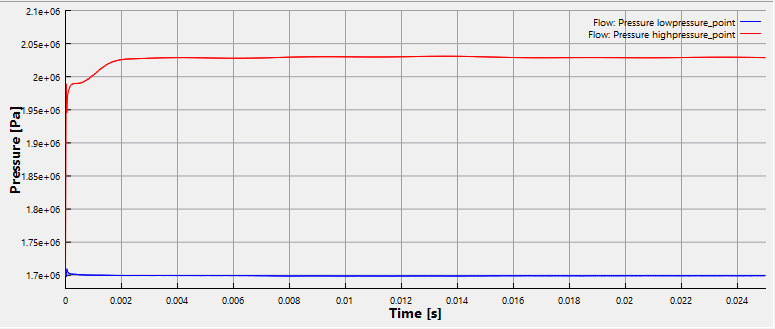
Figure 6.667 - Pressure at monitoring point
Forces
The net force acting on the Ball 3D valve in all three directions are plotted as follows:
- Click Add XY-Plot icon in the Toolbar.
- Select Translation (1 DOF) Ball_main in the Model Panel.
- Click Click for Variable List icon in the Plot Panel.
- Select Net Force and click Plot Selected Variables icon.
- Similarly plot Net Force in the second and third directions by selecting Translation (1 DOF) Ball_second and Translation (1 DOF) Ball_third respectively in the Model Panel.
- Click Plot Property icon. In the Plot Property dialog box, specify 1 N for Maximum and -0.8 N for Minimum under Display Default Range. Click OK.
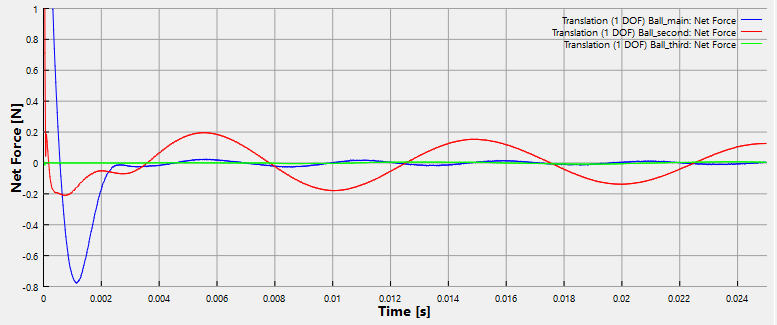
Figure 6.668 - Forces on the valve
Main Displacement
To plot the main direction displacement of the valve in three directions.
- Click Add XY-Plot icon in the Toolbar.
- Select Ball3D Valve in the Model Panel.
- Click Click for Variable List icon in the Plot Panel, select Main Direction Displacement from the Ball 3D Valve list.
- Click Plot Selected Variables icon.
- Click Plot Property icon. In the Plot Property dialog box, specify 0.0005 m for Maximum and 0 m for Minimum under Display Default Range. Click OK.
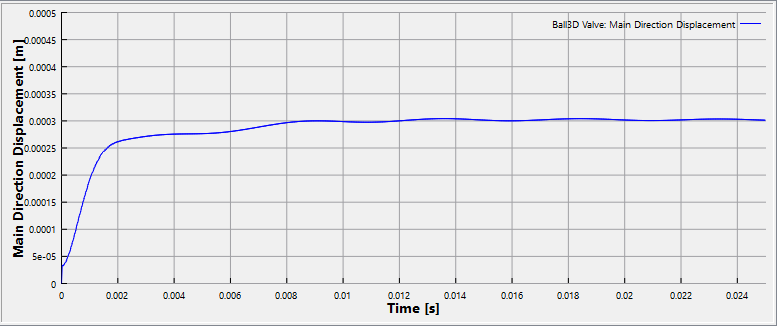
Figure 6.669 - Main Displacement plot
Offset Radius
To plot the offset radius of the valve in three directions.
- Click Add XY-Plot icon in the Toolbar.
- Select Ball3D Valve in the Model Panel.
- Click Click for Variable List icon in the Plot Panel, select Offset Radius from the Ball 3D Valve list.
- Click Plot Selected Variables icon.
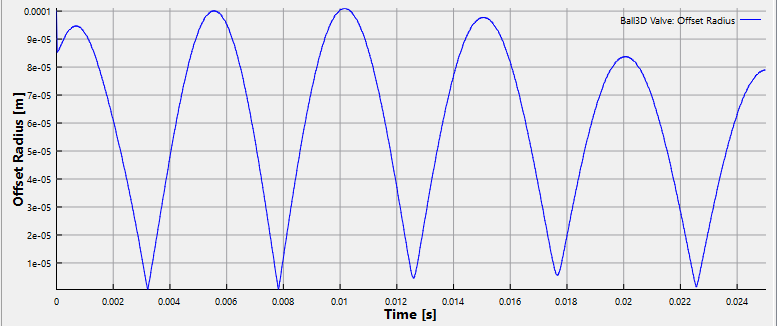
Figure 6.670 - Offset Radius plot