Contours
The most common contours for the ball valve simulation are the pressure and the velocity contours.
Pressure contours
To obtain the pressure contours on the volume:
- Select Volumes in the Geometric Entities Panel.
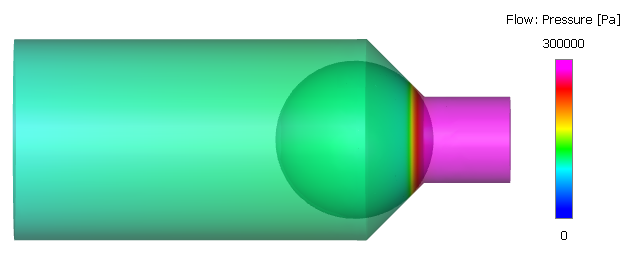
- Select Pressure from the Variables list under Variable drop-down list in the Results Panel. For variables and legends refer, Post-Processing.
- Specify Min as 0 Pa and Max as 300000 Pa in the Results Panel.
- Select Transparent for Transparency in the View Tab of the Properties Panel.
Figure 6.624 shows the pressure contours after 4 cycles and Figure 6.625 shows the pressure contours at a partially open position of the valve.
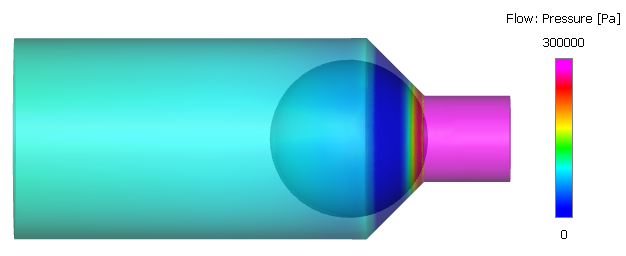
| ´ | Note: The pressure contours at time - 0.032 s is obtained by loading the result file ballvalve_model_0320.sres saved in the working folder. |
Creating a section
The section is created with the following steps:
- Click Create a Cross-Section
 icon in the Geometric Entities Panel. A new entity Section 01 is created under Derived Surfaces.
 - Select Section 01 under Derived Surfaces and specify the Type as Plane X and Position as 0 m in the Geometry Tab of Properties Panel.
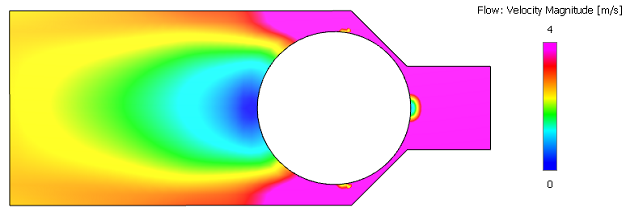
Velocity contours
To obtain the velocity magnitude contours on the section:
- Select the Section 01 under Sections in the Geometric Entities Panel.
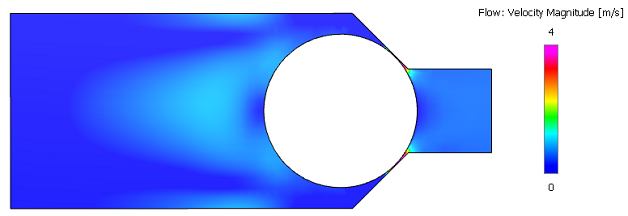
- Select Velocity Magnitude from the Derived Variables drop-down list under Variable option in the Results Panel.
- Specify Min as 0 m/s and Max as 4 m/s in the Results Panel.
Changes to the display, such as legend, contour color, image sizing and transparency can be made under the View Tab of Properties Panel.
Figure 6.626 shows the velocity contours after 4 cycles and Figure 6.627 shows the velocity contours at a partially open position of the valve.
|
Note: The velocity contours at time - 0.032 s is obtained by loading the result file ballvalve_model_0320.sres saved in the working folder. |
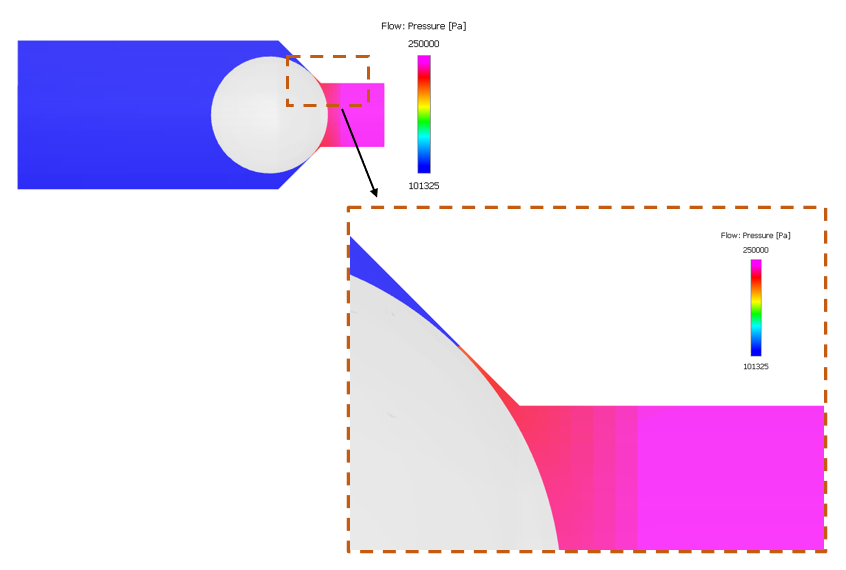
Pressure contours at closed position
The ball valve is modelled using the closure model. Figure 6.628 shows the pressure contours at the closed position of the valve.
To obtain the pressure contours as shown in Figure 6.628, the user needs to load the result file corresponding to the closed position of the valve in the Simulation Panel, switch to Cell Based View and turn off Smooth Color Map in the Results Panel.