Plots
This section shows some of the common plots used in the ball valve simulation. The steps to create the plots are:
- Click Load Results in the Simulation Panel.
- Select the result file ballvalve_model_0400.sres in the ensuing Load Results dialog box, click Open.
Mass Flux
The mass balance is monitored with the mass flux plots.
- Select ballvalve_inlet and ballvalve_outlet under Boundaries in the Geometric Entities Panel.
- Click Add XY-Plot
 icon in the Toolbar.
 - Click Click for Variable List
 icon in the Plot Panel, select Mass Flux from the Flow list.
 - Click Plot Selected Variables
 icon.
icon. - Click Plot Property
 icon, the Plot Property dialog box opens. Enable Moving Average and enter 100. Click OK.
 - Click Combine Entity Data into a Single Curve
 to obtain the net mass flux.
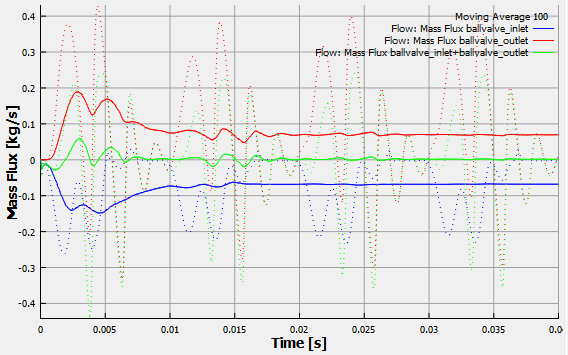
Figure 6.629 - Mass flux plots
| ´ | Note: The moving average is used in transient simulations to obtain the average values of a variable in a sampling interval, over the entire simulation time.To plot the moving average, click Click for Variable List |
Valve Displacement
To plot the displacement of the valve:
- Click Add XY-Plot icon in the Toolbar.
- Select Translation (1 DOF) in the Model Panel.
- Click Click for Variable List icon in the Plot Panel, select Displacement from the Translation (1 DOF) list.
- Click Plot Selected Variables icon.
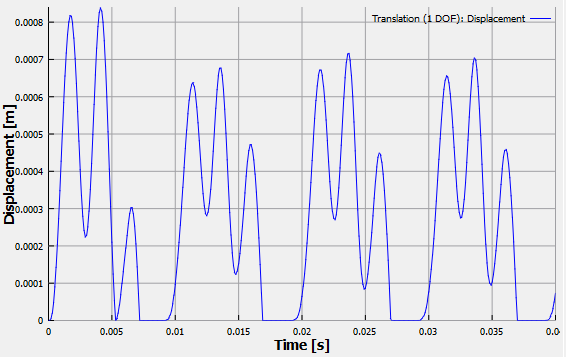
Figure 6.630 - Valve Displacement plot
Pressure
The pressure is plotted at the monitoring points as follows:
- Select highpressure_point and lowpressure_point under Points in the Geometric Entities Panel.
- Click Add XY-Plot icon in the Toolbar.
- Click Click for Variable List icon in the Plot Panel, select Pressure from the Flow list.
- Click Plot Selected Variables icon.
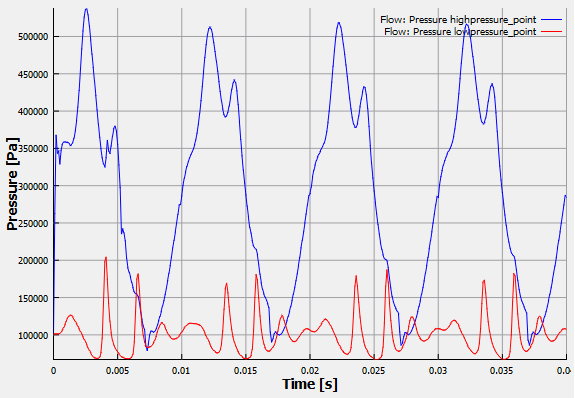
Figure 6.631 - Pressure plots
Forces
The forces acting on the ball valve are plotted as follows:
- Click Add XY-Plot icon in the Toolbar.
- Select Translation (1 DOF) in the Model Panel.
- Click Click for Variable List icon in the Plot Panel. Select Fluid Force from the Translation (1 DOF) list.
- Click Plot Selected Variables icon. Similarly plot Spring Force and Net Force.
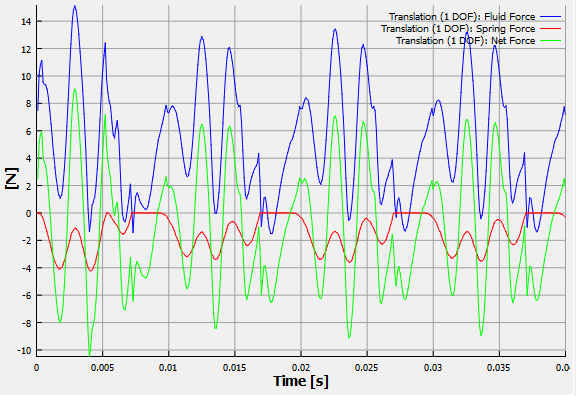
Figure 6.632 - Forces on the valve