|
You are here: Fluid Machinery Templates and Tutorials > Centrifugal Pump > Centrifugal Pump Tutorials > Plots
|
Plots
This section shows some of the common plots used in the steady-state centrifugal simulation. The steps to create the plots are:
- Click Load Results in the Simulation Panel.
- Select the required result file in the ensuing Load Results dialog box, click Open.
Total Pressure
The simulation is performed with a pressure inlet boundary condition and the volumetric flux at the outlet. Hence a plot of the total pressure at the outlet is monitored.
- Select volute_outlet under Boundaries in the Geometric Entities Panel.
- Click Add XY-Plot
 icon in the Toolbar.
 - Click Click for Variable List
 icon in the Plot Panel, select Total Pressure from Flow list.
 - Click Plot Selected Variables
 icon.
icon.
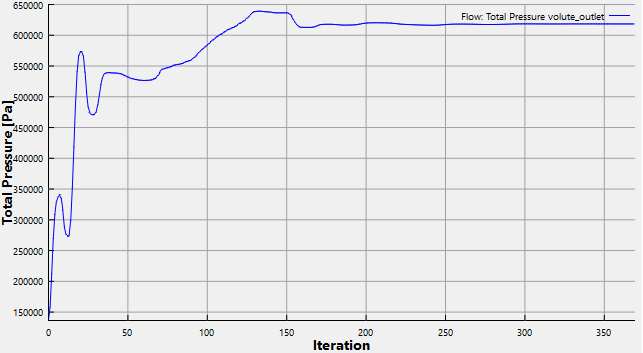
Figure 6.36 - Total Pressure at outlet (Steady-state)
Mass Flux
The mass balance is monitored with the mass flux plots. To create the mass flux plots:
- Select inlet_inlet and volute_outlet under Boundaries in the Geometric Entities Panel.
- Click Add XY-Plot icon in the Toolbar.
- Click Click for Variable List icon in the Plot Panel, select Mass Flux from Flow list.
- Click Plot Selected Variables icon.
- Click Combine Entity Data into a Single Curve
 icon to obtain the net mass flux.
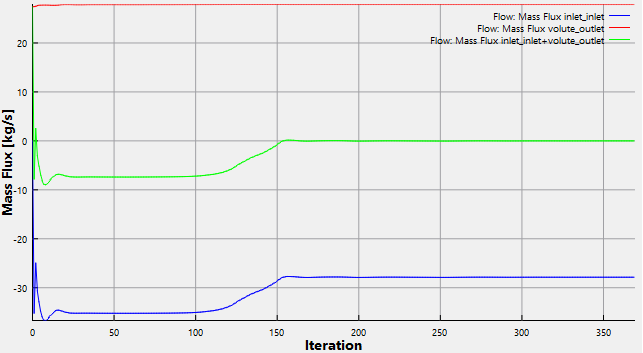
Figure 6.37 - Mass flux (Steady-state)
| ´ | Note:
The moving average is used in transient simulations to obtain the average behavior over the entire simulation time. It can be specified as, click Click for Variable List |