Plots
This section shows some of the common plots used in the Steady state rotating machinery. The steps to create the plots are:
- Click Load Results "(rotating_machinery_model_steady.sres)" in the Simulation Panel.
- Select the required result file in the ensuing Load Results dialog box, click Open.
Total Pressure
The simulation is performed with a pressure inlet boundary condition and the volumetric flux at the outlet. Hence a plot of the total pressure at the outlet is monitored.
- Select volute_outlet under Boundaries in the Geometric Entities Panel.
- Click Add XY-Plot
 icon in the Toolbar.
 - Click Click for Variable List
 icon in the Plot Panel toolbar, select Total Pressure under Flow.
 - Click Plot Selected Variables
 icon.
icon.
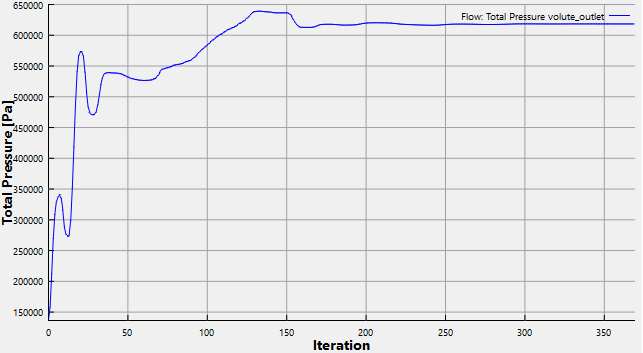
Figure 11.356 - Total Pressure at outlet (Steady-state)
Mass Flux
The mass balance is monitored with the mass flux plots. To create the mass flux plots:
- Select inlet_inlet and volute_outlet under Boundaries in the Geometric Entities Panel.
- Click Add XY-Plot icon in the Toolbar.
- Click Click for Variable List icon in the Plot Panel toolbar, select Mass Flux from Flow list.
- Click Plot Selected Variables icon.
- Click Combine Entity Data into a Single Curve
 icon to obtain the net mass flux.
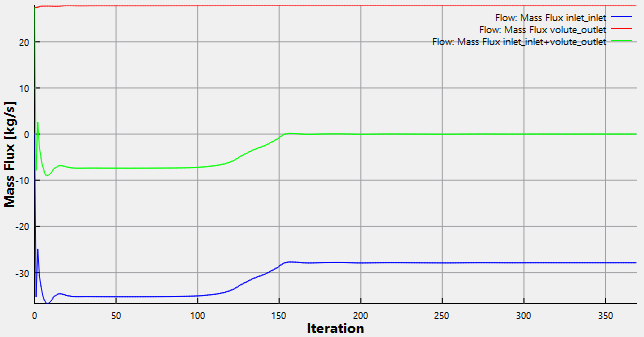
Figure 11.357 - Mass flux (Steady-state)
| ´ | Note: The moving average is used in transient simulations to obtain the average behavior over the entire simulation time. It can be specified as, click Click for Variable List icon in Plot Property and enable Moving Average. The value in the Moving Average input is number of preceding time steps (sampling interval) for calculating the average. |