|
You are here: Fluid Machinery Templates and Tutorials > General Gear > General Gear Tutorials > Plots
|
Plots
This section shows some of the common plots used in the helical gear pump simulation. The steps to create the plots are:
- Click Load Results in the Simulation Panel.
- Select the required result file in the ensuing Load Results dialog box, click Open.
Mass Flux
The mass balance is monitored with the mass flux plots.
- Select inlet1_inlet, inlet2_inlet and outlet2_outlet under Boundaries in the Geometric Entities Panel.
- Click Add XY-Plot
 icon in the Toolbar.
 - Click Click for Variable List
 icon, select Mass Flux under Flow in the Plot Panel.
 - Select Plot Selected Variables
 icon > click Plot Property
  icon. In the Plot Property dialog box enable Moving Average and enter 340, click OK.
 - Click Combine Entity Data into a Single Curve
 to obtain the net mass flux.
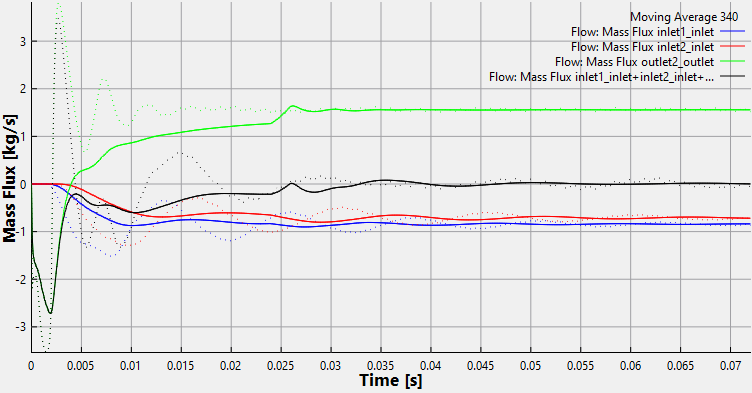
Figure 6.939 - Mass flux
| ´ | Note: The moving average is used in transient simulations to obtain the average behavior over the entire simulation time. It can be specified as, click Click for Variable List |
Pressure
The pressure ripples are monitored at the monitoring point outlet_top. It is obtained as follows:
- Select outlet_point under Points in the Geometric Entities Panel.
- Click Add XY-Plot icon in the Toolbar.
- Click Click for Variable List
 icon in Plot Panel, select Pressure from Flow list.
 - Click Plot Selected Variables icon.
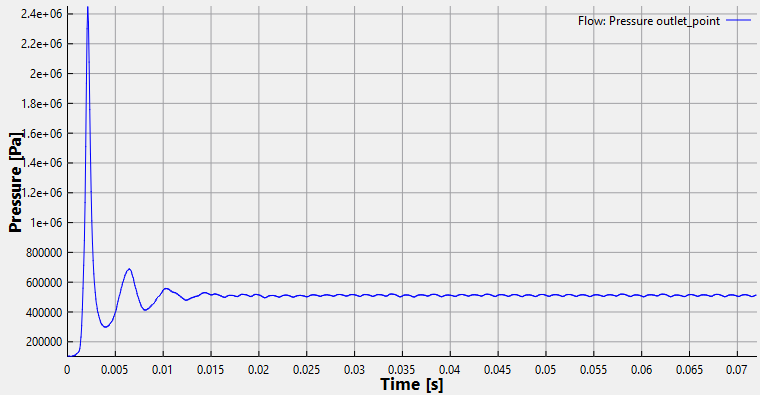
Figure 6.940 - Pressure
Power
The instantaneous integrated power about the axis of rotation for the gear1, gear2 and gear3 is plotted. The power is computed based on the instantaneous integrated torque and the rotation speed.
To create the plot for the power:
- Select generalgear_gear_1_gear, generalgear_gear_2_gear and generalgear_gear_3_gear under Boundaries in the Geometric Entities Panel.
- Click Add XY-Plot icon in the Toolbar.
- Click Click for Variable List icon in Plot Panel, select Revolution Average Power for General Gear list.
- Click Combine Entity Data into a Single Curve to obtain the net power.
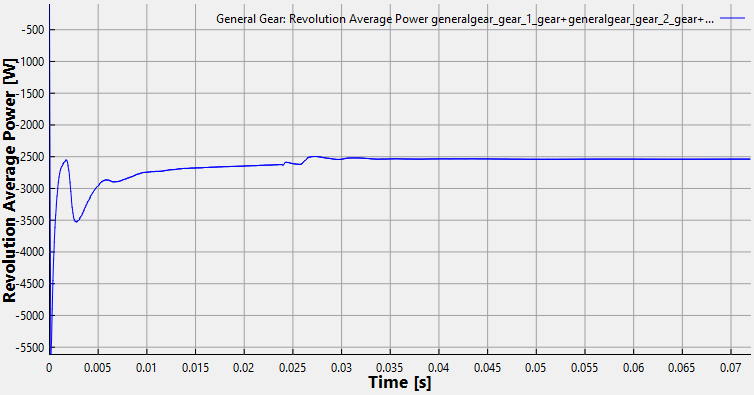
Figure 6.941 - Revolution average power
Volume Flow Rate
The volumetric flux at the outlet of the pump is measured. This is one of the key output from the simulation.
To create the plot for the volumetric flux:
- Select outlet2_outlet under Boundaries in the Geometric Entities Panel.
- Click Add XY-Plot icon in the Toolbar.
- Click Click for Variable List icon in Plot Panel, select Revolution Average Volume Flux for General Gear list.
- Click Plot Selected Variables icon to obtain net outlet flow rate.
- Click Plot Property icon. In the Plot Property dialog box, select L/min under Unit drop-down list, click OK.
- Similarly, click Plot Property icon. In the Plot Property dialog box, specify 150 L/min for Maximum and 0 L/min for Minimum under Display Default Range. Click OK.
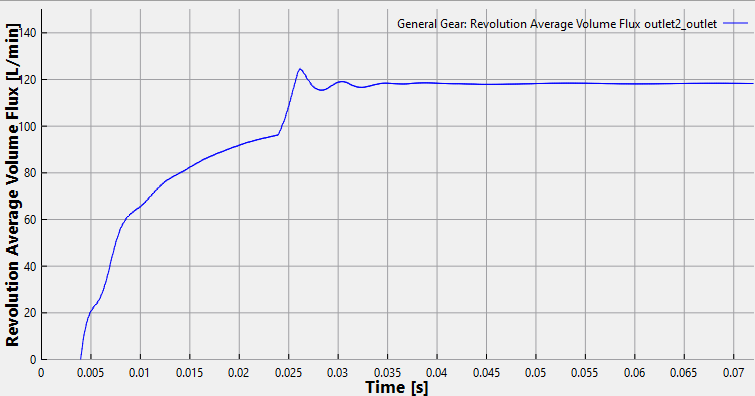
Figure 6.942 - Revolution average volume flux