|
You are here: Fluid Machinery Templates and Tutorials > Rolling Piston > Rolling Piston Compressor Tutorials > Plots
|
Plots
This section shows some of the common plots used in the rolling piston compressor with valve simulation. The plots shown in this section correspond to 4 completed revolutions of the rolling piston compressor:
Mass Flux
The mass balance is monitored with the mass flux plots.
- Select inlet_inlet and outlet_outlet under Boundaries in the Geometric Entities Panel.
- Click Add XY-Plot
 icon in the Toolbar.
 - Click Click for Variable List
 icon in the Plot Panel, select Mass Flux under Flow list.
 - Click Plot Selected Variables
 icon.
icon. - Click Plot Property
 icon, the Plot Property dialog box opens. Enable Moving Average and enter 180. Click OK.
 - Specify 0.003 kg/s for Maximum and -0.003 kg/s for Minimum under Display Default Range. Click OK.
- Click Combine Entity Data into a Single Curve
 to obtain the net mass flux.
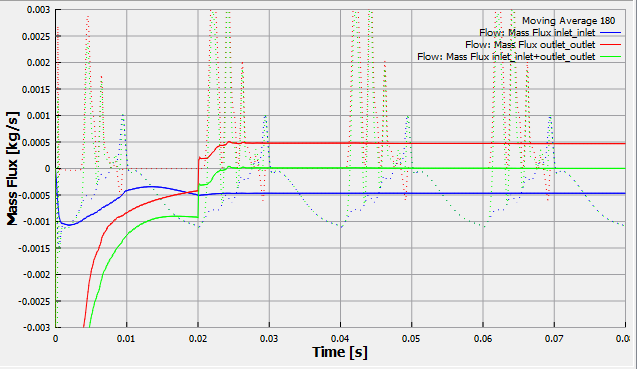
Figure 6.721 - Mass flux plots
| ´ | Note:The moving average is used in transient simulations to obtain the average values of a variable in a sampling interval, over the entire simulation time. To plot the moving average, click, Click for Variable List |
Valve Angle Displacement
To plot the angular displacement of the valve:
- Click Add XY-Plot icon in the Toolbar.
- Select Rotation (1 DOF) in the Model Panel.
- Click Click for Variable List icon in the Plot Panel, select Angle Displacement from Rotation (1 DOF) list.
- Click Plot Selected Variables icon.
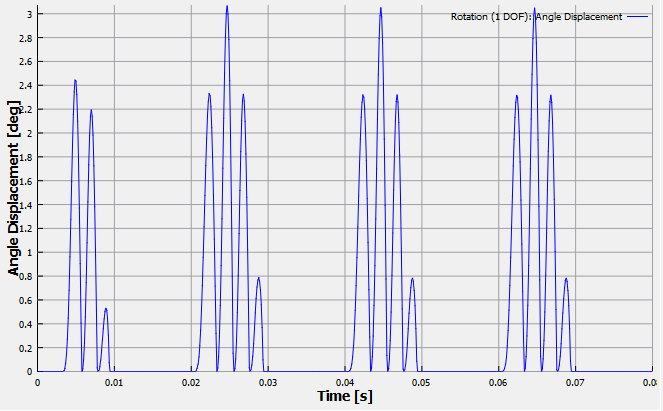
Figure 6.722 - Valve Angle Displacement plot
|
Note: Other parameters, such as the Angular Velocity, Angular Acceleration and Fluid Torque can also be plotted under Rotation (1 DOF). |
Volumetric Flux at outlet
The volumetric flux at the outlet is plotted as follows:
- Select outlet_outlet under Boundaries in the Geometric Entities Panel.
- Click Add XY-Plot icon in the Toolbar.
- Click Click for Variable List icon in the Plot Panel, select Volumetric Flux under Flow list.
- Click Plot Selected Variables icon.
- Click Plot Property icon, the Plot Property dialog box opens.
- Select L/min for Unit under Display Units.
- Specify 200 L/min for Maximum and -100 L/min for Minimum under Display Default Range. Click OK.
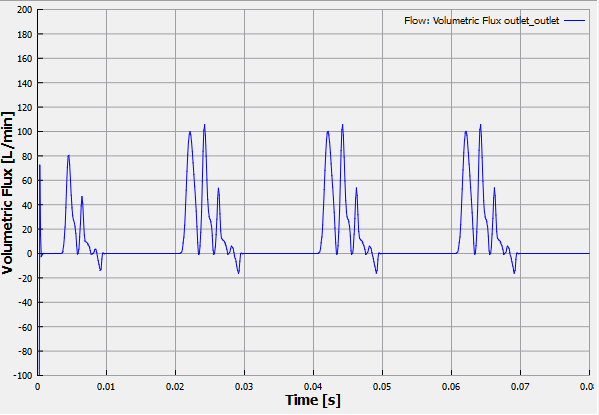
Figure 6.723 - Volumetric Flux at outlet
Temperature at outlet
The temperature at the outlet is plotted as follows:
- Select outlet_outlet under Boundaries in the Geometric Entities Panel.
- Click Add XY-Plot icon in the Toolbar.
- Click Click for Variable List icon in the Plot Panel, select Temperature under Heat list.
- Click Plot Selected Variables icon.
- Click Plot Property icon, the Plot Property dialog box opens.
- Specify 600 K for Maximum and 0 K for Minimum under Display Default Range. Click OK.
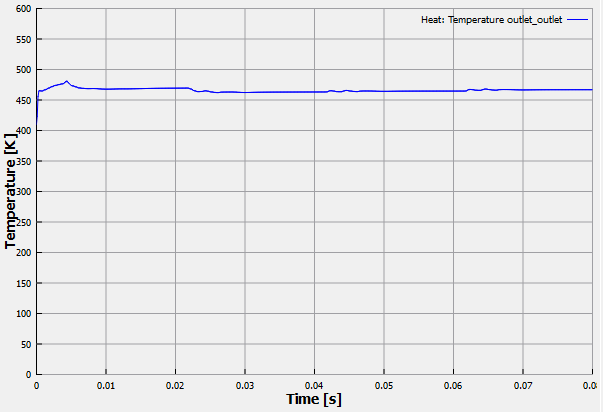
Figure 6.724 - Temperature at outlet
Power
Power is the instantaneous integrated power of a boundary rotating about the Rotational Axis Vector of the rolling piston compressor chamber. To plot the power:
- Select rotor under Boundaries in the Geometric Entities Panel.
- Click Add XY-Plot icon in the Toolbar.
- Click Click for Variable List icon in the Plot Panel, select Revolution Average Power in the Rolling Piston list.
- Click Plot Selected Variables icon.
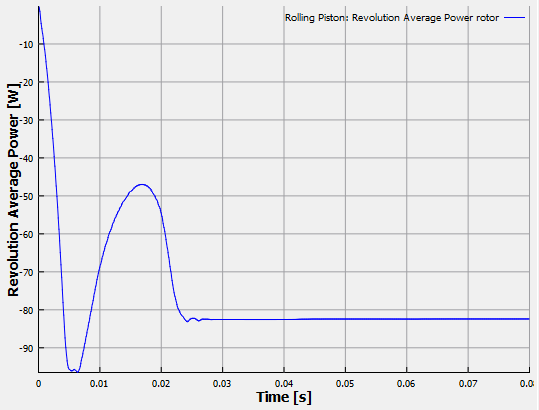
Figure 6.725 - Power plot
Pressure at monitoring point
The pressure is plotted at the monitoring point as follows:
- Select port_point under Points in the Geometric Entities Panel.
- Click Add XY-Plot icon in the Toolbar.
- Click Click for Variable List icon in the Plot Panel, select Pressure from the Flow list.
- Click Plot Selected Variables icon.
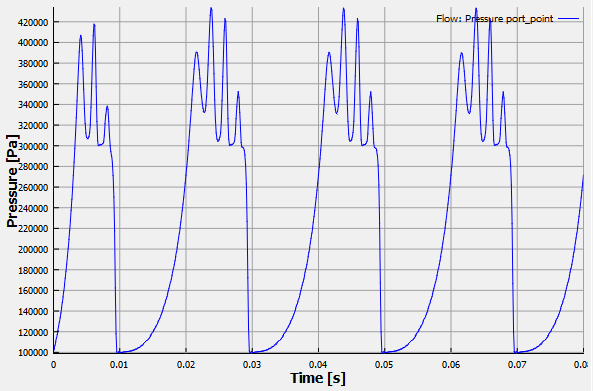
Figure 6.726 - Pressure at monitoring point
Temperature at monitoring point
The temperature is plotted at the monitoring point as follows:
- Select port_point under Points in the Geometric Entities Panel.
- Click Add XY-Plot icon in the Toolbar.
- Click Click for Variable List icon in the Plot Panel, select Temperature from the Heat list.
- Click Plot Selected Variables icon.
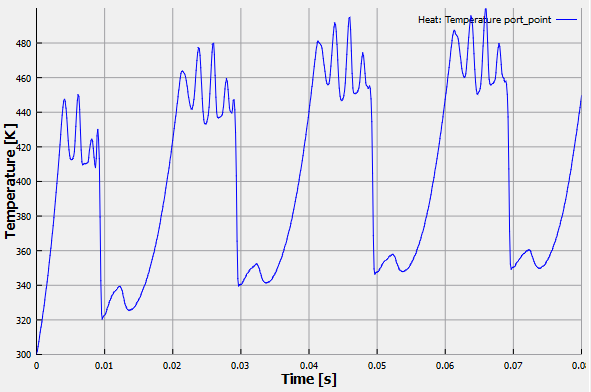
Figure 6.727 - Temperature at monitoring point