|
You are here: Fluid Machinery Templates and Tutorials > Rotational Valve > Circumferential Valve Tutorial > Plots
|
Plots
This section shows some of the common plots used in the circumferential valve simulation. The steps to create the plots are:
- Click Load Results in the Simulation Panel.
- Select the required result file in the ensuing Load Results dialog box, click Open.
Mass Flux
The mass balance is monitored with the mass flux plots.
- Select inlet_inlet and outlet_outlet under Boundaries in the Geometric Entities Panel.
- Click Add XY-Plot
 icon in the Toolbar.
 - Click Click for Variable List
 icon, select Mass Flux under Flow in the Plot Panel.
 - Click Plot Selected Variables
 icon.
icon. - Click Combine Entity Data into a Single Curve
 to obtain the net mass flux.
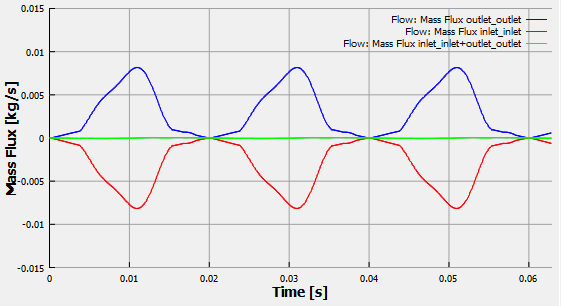
Figure 6.593 - Mass flux plots
| ´ | Note: The moving average is used in transient simulations to obtain the average behavior over the entire simulation time. It can be specified as, click Click for Variable List |
Angle Displacement
To plot the angular displacement of the valve:
- Click Add XY-Plot icon in the Toolbar.
- Select Rotation (1 DOF) in the Model Panel.
- Click Click for Variable List
 icon in the Plot Panel, select Angle Displacement from Rotation (1 DOF) list.
 - Click Plot Selected Variables icon.
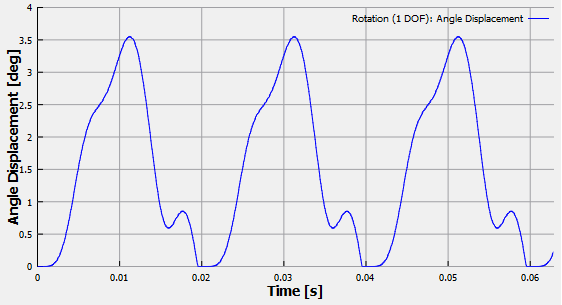
Figure 6.594 - Angle displacement plot
| Note: Other parameters such as the Angular Velocity, Angular Acceleration, Fluid Torque can also be plotted under Rotation (1 DOF). |