|
You are here: Fluid Machinery Templates and Tutorials > Swash Plate Piston Pump > Swash Plate Piston Pump Tutorial > Plots
|
Plots
This section shows some of the common plots used in the swash plate piston pump simulation. The steps to create the plots are:
- Click Load Results in the Simulation Panel.
- Select the required result file in the ensuing Load Results dialog box, click Open.
Mass Flux
The mass balance is monitored with the mass flux plots. The plot is obtained as follows
- Select inlet_inlet and outlet_outlet under Boundaries in the Geometric Entities Panel.
- Click Add XY-Plot
 icon in the Toolbar.
 - Click Click for Variable List
 icon in the Plot Panel toolbar, select Mass Flux under Flow list.
 - Click Plot Selected Variables
 icon.
icon. - Click Plot Property
 icon. The Plot Property dialog box opens, enable Moving Average, enter 270 and click OK.
 - Click Combine Entity Data into a Single Curve
 to obtain the net mass flux.
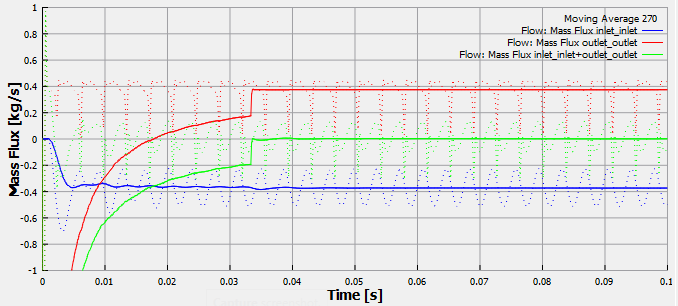
Figure 6.446 - Mass flux
| ´ | Note: The moving average is used in transient simulations to obtain the average behavior over the entire simulation time.It can be specified as, click Click for Variable List |
Pressure
The pressure is plotted at the monitoring points Cylinder_point and Outlet_point. The plot is obtained as follows:
- Select Cylinder_point and Outlet_point under Points in the Geometric Entities Panel.
- Click Add XY-Plot icon in the Toolbar.
- Click Click for Variable List
 icon in Plot Panel toolbar, select Pressure in the Flow list.
 - Click Plot Selected Variables icon in the Plot Panel.
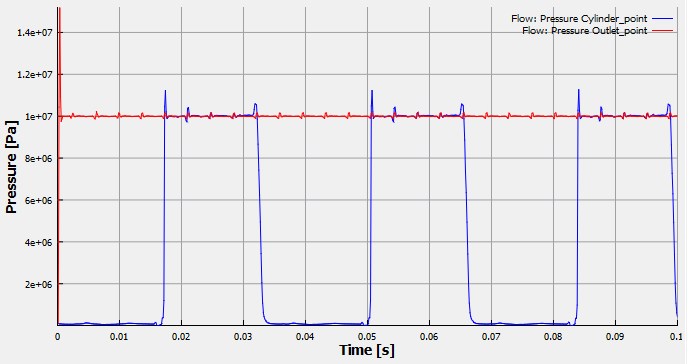
Figure 6.447 - Pressure
Power
Power is the instantaneous integrated power of a boundary rotating about the Rotational Axis Vector of the Piston/Cylinder Assembly. The plot is obtained as follows:
- Select piston_wall under Boundaries in the Geometric Entities Panel.
- Click Add XY-Plot icon in the Toolbar.
- Click Click for Variable List icon in Plot Panel toolbar, select Power in the Flow list.
- Click Plot Selected Variables icon to obtain the power.
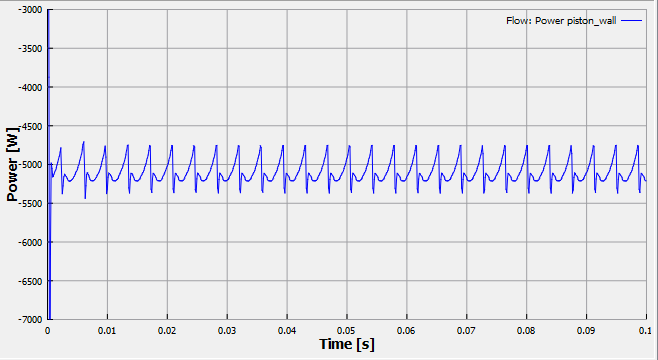
Figure 6.448 - Power
Pocket Total Volume
The pocket total volume is monitored at the cylinder pocket. The plot is obtained as follows:
- Select Cylinder_point under Points in the Geometric Entities Panel.
- Click Add XY-Plot icon in the Toolbar.
- Click Click for Variable List icon in Plot Panel toolbar, select Pocket Total Volume in the Swash Plate Piston list.
- Click Plot Selected Variables icon in the Plot Panel.
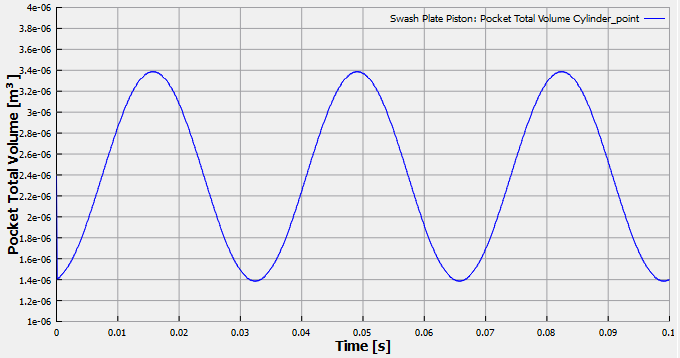
Figure 6.449 - Pocket total volume