Plots
This section shows some of the common plots used in the vane pump simulation. The steps to create the plots are:
- Click the Load Results option in the Simulation Panel.
- Select the required result file in the ensuing Load Results dialog box, click Open.
Mass Flux
The mass balance is monitored with the mass flux plots.
- Select inlet_inlet and outlet_outlet under Boundaries in the Geometric Entities Panel.
- Click Add XY-Plot
 icon in the Toolbar.
 - Click Click for Variable List
 icon, select Mass Flux under Flow in the Plot Panel .
 - Select Plot Selected Variables
 icon > click Plot Property
  icon. In the Plot Property dialog box enable Moving Average and enter 210, click OK.
 - Click Combine Entity Data into a Single Curve
 to obtain the net mass flux.
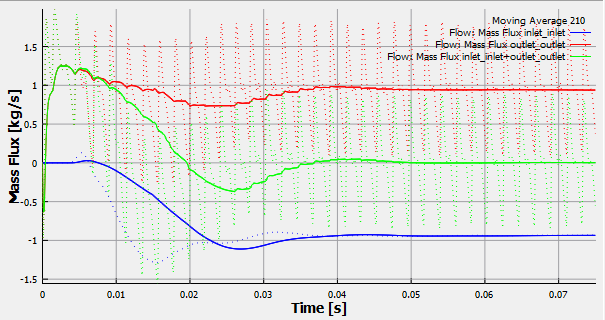
Figure 6.246 - Mass flux
| ´ | Note: The moving average is used in transient simulations to obtain the average behavior over the entire simulation time. It can be specified under Click for Variable List > Plot Property dialog box > enable Moving Average. The value in the Moving Average input is number of preceding time steps (sampling interval) for calculating the average. |
Pressure
The pressure ripples are monitored at the monitoring point outlet_point. It is obtained as follows:
- Select outlet_point under Points in the Geometric Entities Panel.
- Click Add XY-Plot icon in the Toolbar.
- Click Click for Variable List icon in Plot Panel toolbar, select Pressure in the Flow list.
- Click Plot Selected Variables icon in the Plot Panel toolbar.
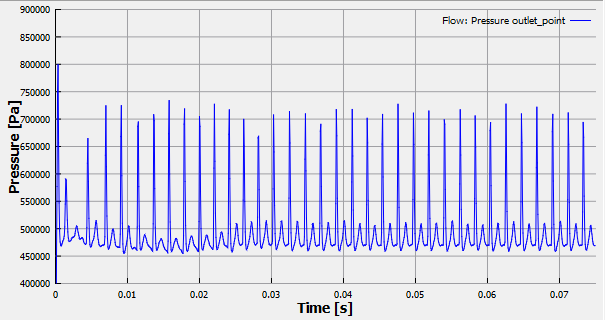
Figure 6.247 - Pressure
|
Note: Unit of pressure can be changed as, select Plot Property |
Pocket Total Volume and Pocket Gas Volume
The pocket total volume and gas volume are monitored at the monitoring point pocket. It is obtained as follows:
- Select pocket _point under Points in the Geometric Entities Panel.
- Click Add XY-Plot icon in the Toolbar.
- Click Click for Variable List icon in Plot Panel toolbar, select Pocket Total Volume and Pocket Gas Volume in the Vane list.
- Click Plot Selected Variables icon in the Plot Panel toolbar.
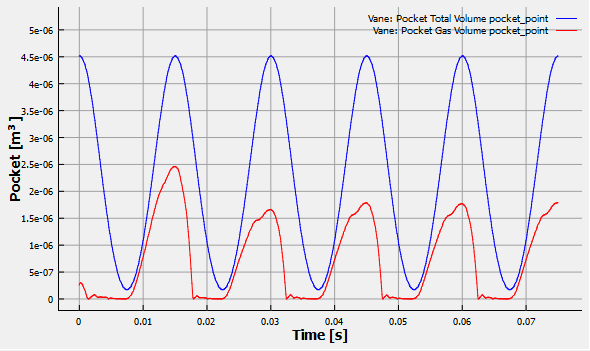
Figure 6.248 - Pocket total volume and Pocket gas volume
|
Note:
|
Power
The instantaneous integrated power about the axis of rotation for the rotor and vane is plotted.
To create the plot for the power:
- Select rotor and vane under Boundaries in the Geometric Entities Panel.
- Click Add XY-Plot icon in the Toolbar.
- Click Click for Variable List icon in Plot Panel toolbar, select Revolution Average Power in the Vane list.
- Click Combine Entity Data into a Single Curve to obtain the power.
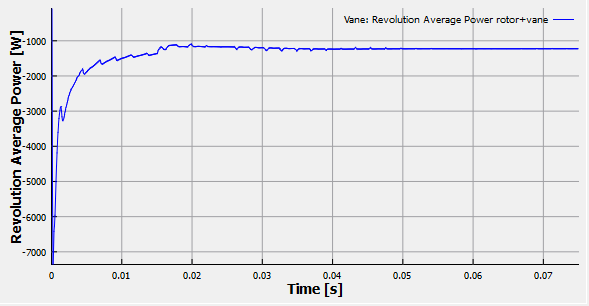
Figure 6.249 - Revolution average power