|
You are here: Additional Templates and Tutorials > GT-SUITE Coupling Module and Tutorial > GT Coupling Tutorials > Plots
|
Plots
Mass Balance plot
The mass balance is monitored with the mass flux plots. To create the mass flux plots:
- Select inlet_inlet and volute_outlet under Boundaries in the Geometric Entities Panel.
- Click Add XY-Plot
 icon in the Toolbar.
 - Click Click for Variable List
 icon in Plot Panel and select Mass Flux from the Flow list.
 - Click Combine Entity Data into a Single Curve
 icon to obtain the net Mass Flux.
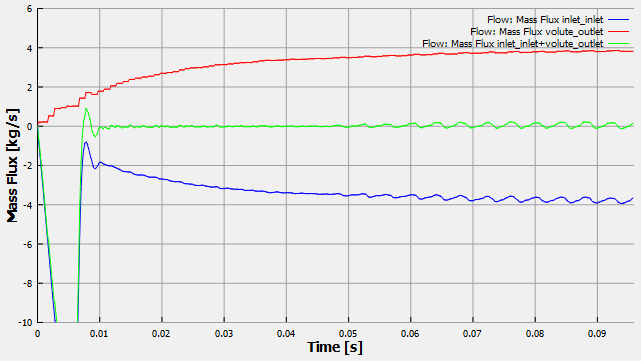
Figure 10.134 - Mass Flux plots
Pressure plot
To plot pressure at the inlet and outlet:
- Select inlet_inlet and volute_outlet under Boundaries in the Geometric Entities Panel.
- Click Add XY-Plot icon in the Toolbar.
- Click Click for Variable List icon in Plot Panel and select Pressure from the Flow list.
- Click Plot Selected Variables
 icon.
icon. - Click Plot Property
 icon, the Plot Property dialog box opens. Select bar from the Unit drop-down list under Display Units. Set Maximum as 10 and Minimum as 0 under Display Default Range.
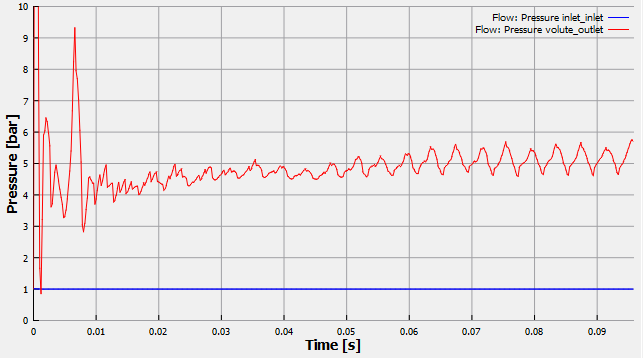
Figure 10.135 - Pressure plots