|
You are here: Additional Templates and Tutorials > GT-SUITE Coupling Module and Tutorial > GT Coupling Tutorials > Post-processing
|
Post-processing
This section explains the steps to obtain results from the simulation.
Plots
Pressure plots
To plot pressure at the inlet and outlet:
- Select in and out under Boundaries in the Geometric Entities Panel.
- Click Add XY-Plot
 icon in the Toolbar.
 - Click Click for Variable List
 icon in Plot Panel and select Pressure from the Flow list.
 - Click Plot Selected Variables
 icon .
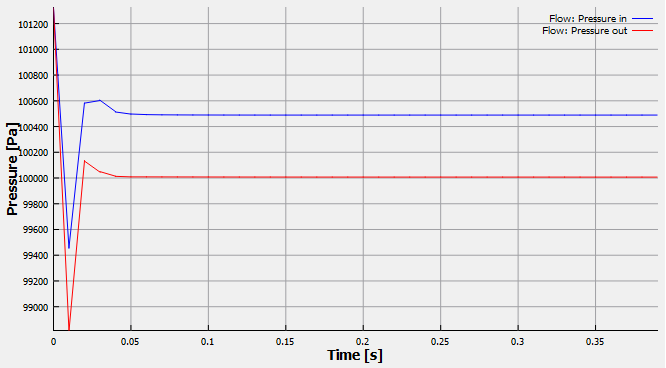
Figure 10.110 - Pressure plots
Velocity Magnitude Contours
A section is created with the following steps:
- Click Create a Cross-Section
 icon in the Geometric Entities Panel. A new section Section 01 is created under Derived Surfaces.
 - Select Section 01 under Derived Surfaces and specify the Type and Position as Plane Z and 0 m in the Geometry Tab of Properties Panel.
To plot the velocity magnitude contours:
- Select Section 01 under Derived Variables in the Geometric Entities Panel.
- Select Velocity Magnitude from the Derived Variables list under the Variable drop-down list in the Results Panel.
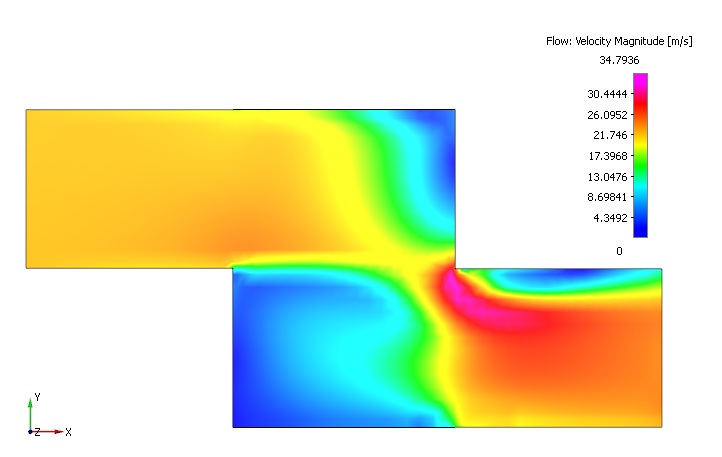
Figure 10.111 - Velocity contours