Plots
This section shows some of the common plots used in the cabin radiation simulation. The steps to create the plots are:
- Click Load Results in the Simulation Panel.
- Select the required result file in the ensuing Load Results dialog box, click Open.
Temperature
The temperature is monitored at the monitoring point. It is obtained as follows:
- Select Chair_point and Window_point under Points in the Geometric Entities Panel.
- Click Add XY-Plot
 in the Toolbar.
 - Click Click for Variable List
 in Plot Panel toolbar, select Temperature in the Heat list.
 - Click Plot Selected Variables
 in the Plot Panel toolbar.
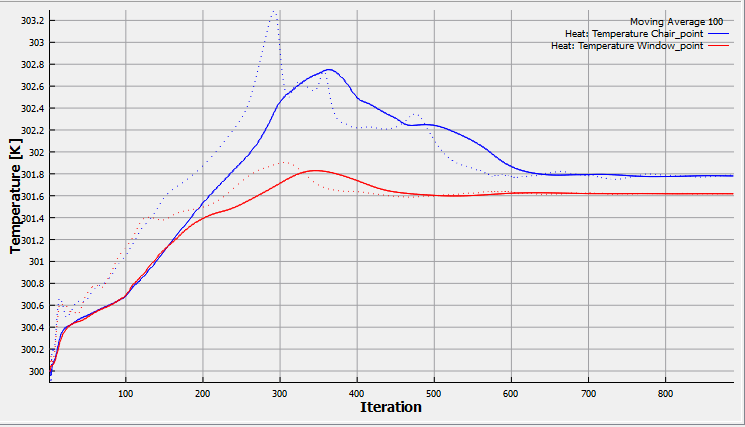
Figure 11.147 - Temperature at points