11.12.3 Simulation
This section explains the settings to run the turbulent flow in a diffuser simulation.
Create Monitoring Points
The steps to create the monitoring points are as follows:
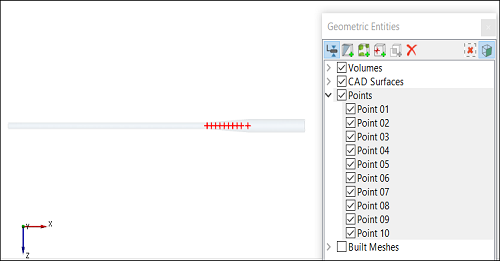
- On the Geometric Entities Panel toolbar, click ten times Create a Monitoring Point
 to create Points Point 01 to Point 10.
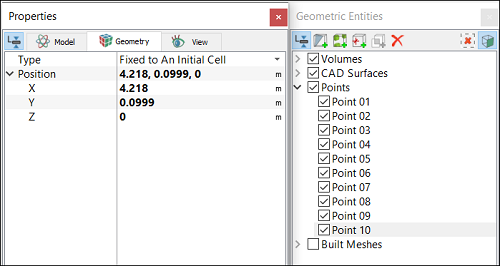
 - Select each point in the Geometric Entities Panel, and specify their Position values, as shown in Table 11.11 in the Geometry Tab of Properties Panel refer, Figure 11.268
| Points | Position values |
|---|---|
| Point 01 | 3.5, 0.050400, 0 |
| Point 02 | 3.575, 0.0559, 0 |
| Point 03 | 3.65, 0.0609, 0 |
| Point 04 | 3.725, 0.0664, 0 |
| Point 05 | 3.8, 0.0714, 0 |
| Point 06 | 3.875, 0.0764, 0 |
| Point 07 | 3.95, 0.0819, 0 |
| Point 08 | 4.025, 0.0864, 0 |
| Point 09 | 4.1, 0.0919, 0 |
| Point 10 | 4.218, 0.0999, 0 |
|
Note: Monitoring points need to be created before running the simulation for recording data, refer Figure 11.268 The position of a Points may also be dragged to a new location using the Select |
|
|
Figure 11.268 - Creating monitoring points
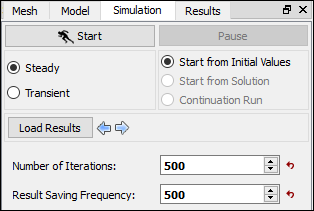
Steady Simulation Settings
|
The residuals for the Steady-state simulation are displayed under the Residual Tab in the Plot Panel as shown in Figure 11.270).
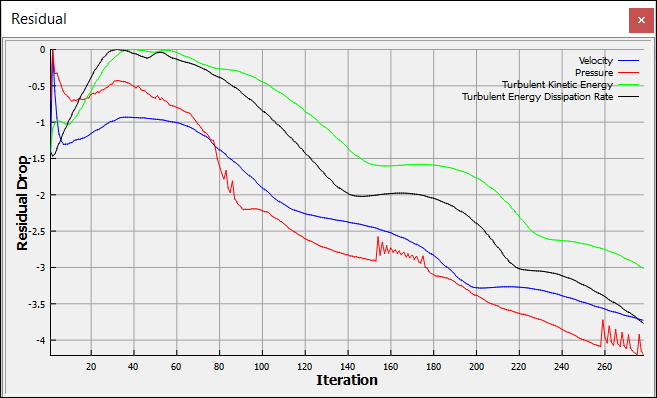
| Note: For a Steady State Simulation, the result file is saved as .sres in the working folder and the same file gets overwritten at regular intervals specified by the Result Saving Frequency parameter. The final result file is written at the end of all iteration or when the solution converges. |