Plots
This section shows some of the common plots used in the simulation. The steps to create the plots are:
- Click Load Results in the Simulation Panel.
- Select the required result file from the Load Results dialog box, click Open.
Temperature of Air
- Select Air_inlet and Air_outlet under Boundaries of Air Volumes in the Geometric Entities Panel.
- Click Add XY-Plot
 icon in the Toolbar.
 - Click Click for Variable List
 icon in the Plot Panel toolbar, select Temperature under Heat.
 - Click Plot Selected Variables
 icon in the Plot Panel toolbar.
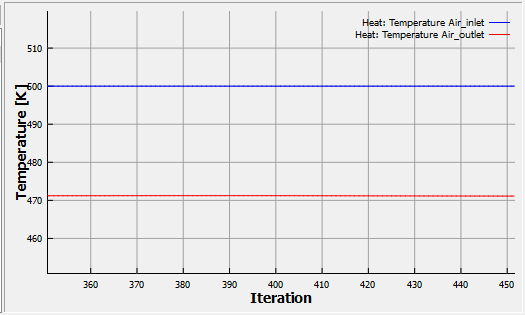
Figure 11.68 - Temperature of air
Temperature of Coolant
- Select Coolant_inlet and Coolant_outlet under Boundaries of Coolant Volumes in the Geometric Entities Panel.
- Click Add XY-Plot icon in the Toolbar.
- Click Click for Variable List icon in the Plot Panel toolbar, select Temperature under Heat.
- Click Plot Selected Variables icon in the Plot Panel toolbar.
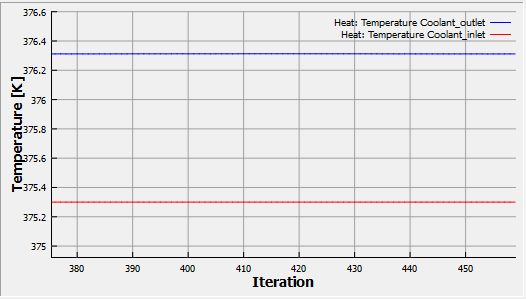
Figure 11.69 - Temperature of coolant
Heat Flux
- Select Air_inlet and Air_outlet under Boundaries of Air Volumes in the Geometric Entities Panel.
- Click Add XY-Plot icon in the Toolbar.
- Click Click for Variable List icon in the Plot Panel toolbar, select Total Flux under Heat.
- Click Combine Entity Data into a Single Curve
 icon to obtain the net heat flux through the Boundaries.
 - Select Coolant_inlet and Coolant_outlet under Boundaries of Coolant Volumes in the Geometric Entities Panel.
- Click Click for Variable List icon in the Plot Panel toolbar, select Total Flux under Heat.
- Click Combine Entity Data into a Single Curve icon to obtain the net heat flux through the Boundaries.
- Select Air_inlet, Air_outlet , Coolant_inlet and Coolant_outlet under Boundaries of Air and Coolant Volumes in the Geometric Entities Panel.
- Click Combine Entity Data into a Single Curve icon to obtain the net heat flux through the Boundaries.
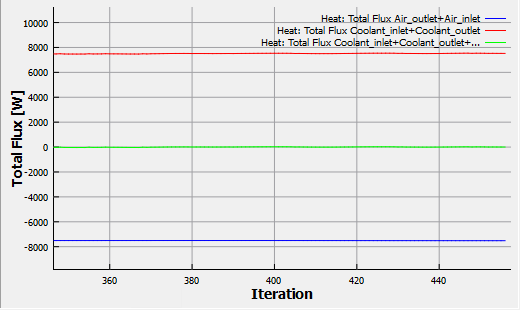
Figure 11.70 - Heat flux
Pressure loss of Air
- Select Air_inlet and Air_outlet under Boundaries of Air Volumes in the Geometric Entities Panel.
- Click Add XY-Plot icon in the Toolbar.
- Click Click for Variable List icon in the Plot Panel toolbar, select Pressure under Flow.
- Click Plot Selected Variables icon.
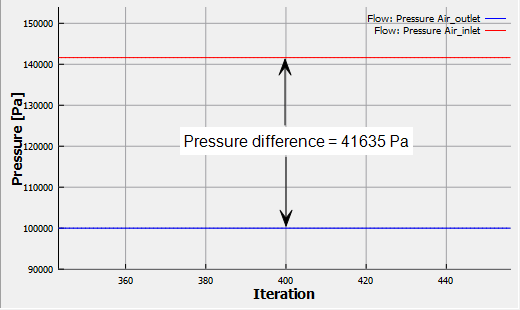
Figure 11.71 - Pressure loss of Air
Pressure loss of Coolant
- Select Coolant_inlet and Coolant_outlet under Boundaries of Coolant Volumes in the Geometric Entities Panel.
- Click Add XY-Plot icon in the Toolbar.
- Click Click for Variable List icon in the Plot Panel toolbar, select Pressure under Flow.
- Click Plot Selected Variables icon.
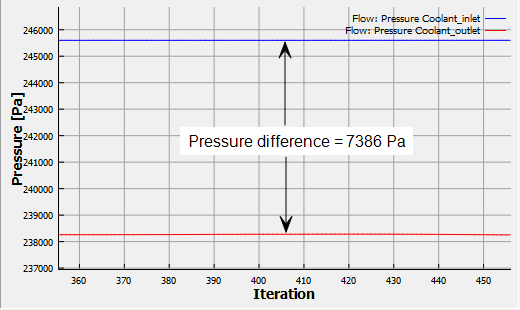
Figure 11.72 - Pressure loss of Coolant