Plots
This section shows some of the common plots used in the simulation. The steps to create the plots are:
- Click Load Results in the Simulation Panel.
- Select the required result file in the ensuing Load Results dialog box, click Open.
Pressure Force
The force exerted by the pressure in flow direction over the truck body, is monitored by plotting the net Pressure Force X. Plot the pressure force on the surfaces of the truck as follows:
- Select CAB, TIRE_1, TIRE_2, TIRE_3, TIRE_4, TIRE_5, TIRE_6, TIRE_7, TIRE_8, TIRE_L_1, TIRE_L_2 and TRAILER boundaries under Volumes in the Geometric Entities Panel.
- Click Add XY-Plot
 in the Toolbar.
 - Click Click for Variable List
 in Plot Panel toolbar, select Pressure Force X from Flow list.
 - Click Combine Entity Data into a Single Curve
 to obtain the net pressure force.
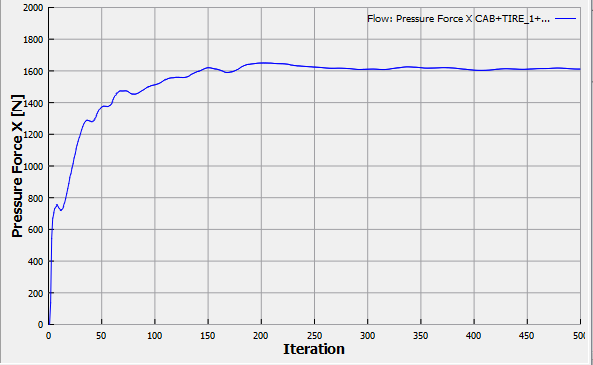
Figure 11.194 - Pressure force X
Shear Force
To plot the shear force X on the surfaces of the truck do the steps as follows:
- Select CAB, TIRE_1, TIRE_2, TIRE_3, TIRE_4, TIRE_5, TIRE_6, TIRE_7, TIRE_8, TIRE_L_1, TIRE_L_2 and TRAILER boundaries under Volumes in the Geometric Entities Panel.
- Click Add XY-Plot in the Toolbar.
- Click Click for Variable List in Plot Panel toolbar, select Shear Force X from Flow list.
- Click Combine Entity Data into a Single Curve to obtain the net shear force.
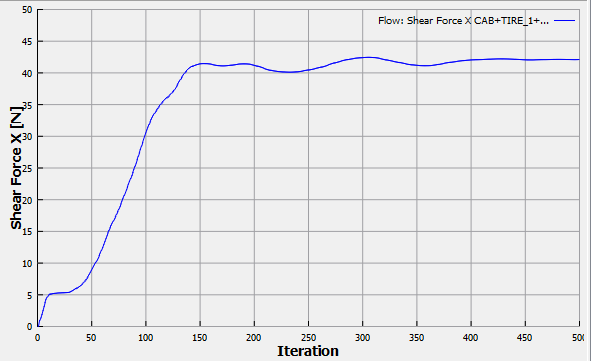
Figure 11.195 - Shear force X
Drag Coefficient
To plot the drag force and drag coefficient do the steps as follows:
- Select Common in the Model Panel.
- Click Add XY-Plot in the Toolbar.
- Click Click for Variable List in Plot Panel toolbar and then select Drag force or Coefficient_of_Drag from Common list.
- Click Plot Selected Variables
 .
.
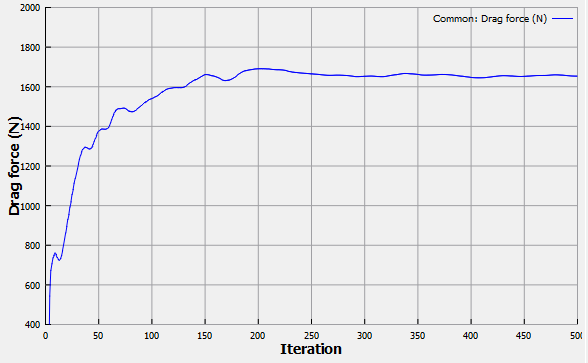
Figure 11.196 - Drag force |
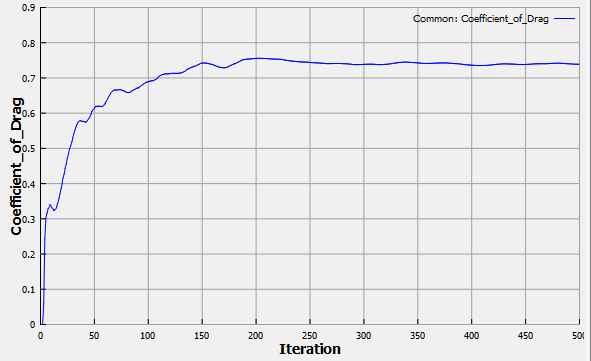
Figure 11.197 - Coefficient of drag |