Plots
This section shows some of the common plots used in the simulation. The steps to create the plots are:
- Click Load Results in the Simulation Panel.
- Select the required result file from the Load Results dialog box, click Open.
Mass Flux
The mass balance is monitored with the mass flux plots.
- Select inlet and outlet under Boundaries in the Geometric Entities Panel
- Click Add XY-Plot
 icon in the Toolbar.
 - Click Click for Variable List
 icon in the Plot Panel toolbar, select Mass Flux under Flow.
 - Click Plot Selected Variables
 icon.
icon. - Click on Combine Entity Data into a Single Curve
 icon to obtain the net mass flux.
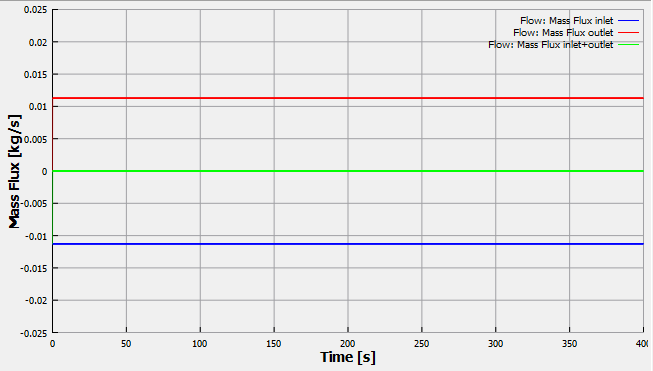
Figure 11.95 - Mass flux
|
Note: The moving average is used in transient simulations to obtain the average behavior over the entire simulation time. It can be specified as, click Click for Variable List |
Pressure
- Select Point 01 under Points in the Geometric Entities Panel.
- Click Add XY-Plot icon in the Toolbar.
- Click Click for Variable List icon in the Plot Panel toolbar, select Pressure under Flow.
- Click Plot Selected Variables icon in the Plot Panel toolbar.
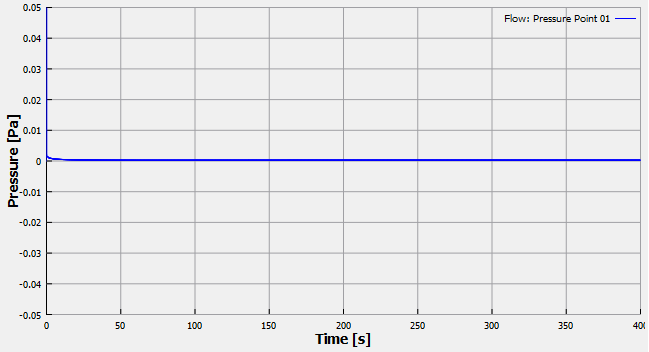
Figure 11.96 - Pressure
Temperature
- Select Point 01 under Points in the Geometric Entities Panel.
- Click Add XY-Plot icon in the Toolbar.
- Click Click for Variable List icon in the Plot Panel toolbar, select Temperature under Heat.
- Click Plot Selected Variables icon in the Plot Panel toolbar.
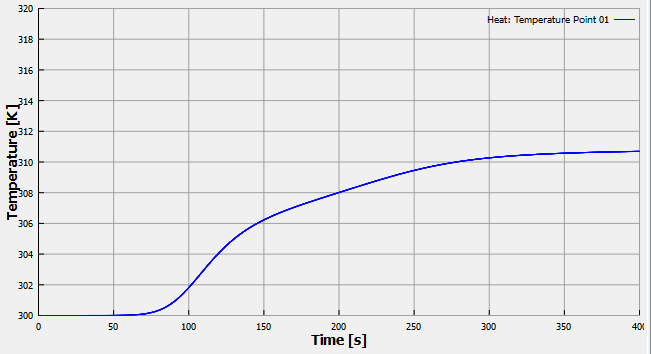
Figure 11.97 - Temperature