Plots
This section shows some of the common plots used in the multicomponent mixing. The steps to create the plots are:
- Click Load Results in the Simulation Panel.
- Select the required result file in the ensuing Load Results dialog box, click Open.
Outlet Concentrations
The concentration of different components is monitored at the outlet.
- Select nozzle_outlet under Volumes > nozzle > Boundaries in the Geometric Entities Panel.
- Click Add XY-Plot
 icon in the Toolbar.
 - Click Click for Variable List
 icon in the Plot Panel toolbar, select Concentration under Component H2O.
 - Click Plot Selected Variables
 icon.
icon. - Select Concentration under Component O2, click Plot Selected Variables icon.
-
Select Concentration under Component CH4, click Plot Selected Variables
icon.
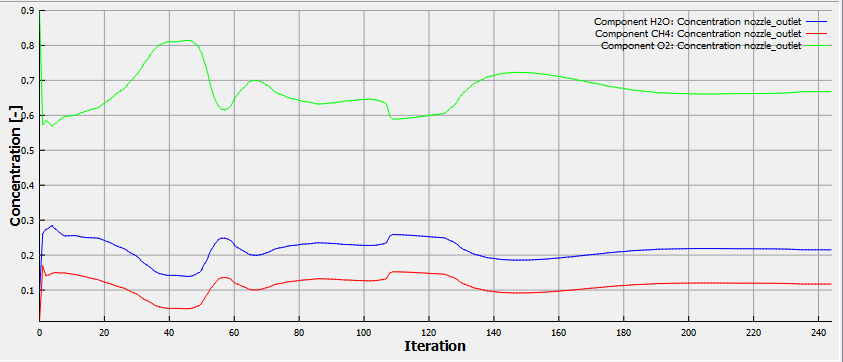
Figure 11.175 - Concentration of different components
Concentration at Throat centre Point
The concentration of different components is monitored at the two points namely throat_centre_point and throat_edge_point. It is obtained as follows:
- Select throat_centre_point under Points in the Geometric Entities Panel.
- Click Add XY-Plot icon in the Toolbar.
-
Click Click for Variable List
icon in the Plot Panel toolbar, select Concentration under Component H2O. - Click Plot Selected Variables icon.
- Select Concentration under Component O2, click Plot Selected Variables icon.
- Select Concentration under Component CH4, click Plot Selected Variables icon.
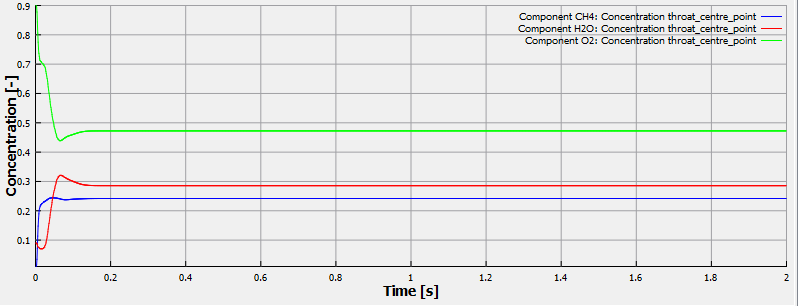
Figure 11.176 - Concentration at throat centre point
Concentration at Monitoring Point
- Select throat_edge_point under Points in the Geometric Entities Panel.
- Click Add XY-Plot icon in the Toolbar.
-
Click Click for Variable List
icon in the Plot Panel toolbar, select Concentration under Component H2O. - Click Plot Selected Variables icon.
- Select Concentration under Component O2, click Plot Selected Variables icon.
- Select Concentration under Component CH4, click Plot Selected Variables icon.
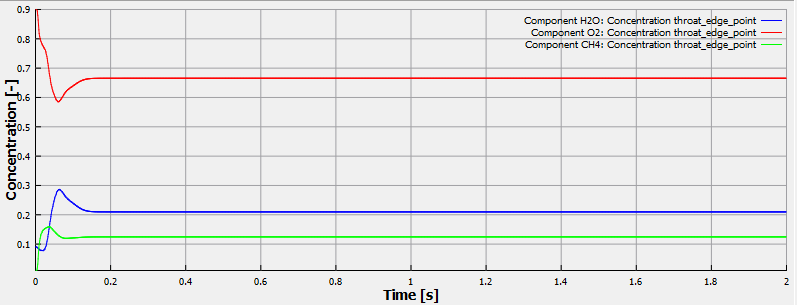
Figure 11.177 - Concentration at monitoring point