Plots
This section shows some of the common plots used in the VOF-tank filling simulation. The steps to create the plots are:
- Click Load Results in the Simulation Panel.
- Select the required result file in the ensuing Load Results dialog box, click Open.
Volume Fraction
The volume fraction is monitored with the volume fraction plots.
- Select Tank under Volumes in the Geometric Entities Panel.
- Click Add XY-Plot
 icon in the Toolbar.
 - Click Click for Variable List
 icon in the Plot Panel toolbar, select Volume Fraction under Component air.
 - Click Plot Selected Variables
 icon.
icon. - Select Volume Fraction under Component fuel, click Plot Selected Variables icon.
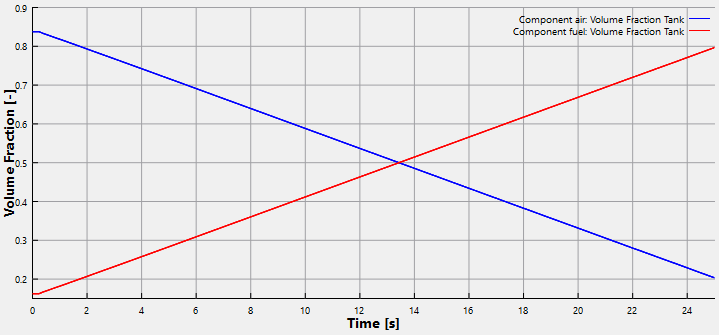
Figure 11.124 - Volume fraction
| Note: The above plot shows Volume Fraction of gas and oil in the tank. As the time of filling increases oil in the tank is incressing up to 81%. Air in the tank is exhausted through the vent out and decreasing up to 19%. |
Pressure
The tank pressure is monitored at the monitoring point Tank_pressure point. It is obtained as follows:
- Select Tank_pressure point under Points in the Geometric Entities Panel.
- Click Add XY-Plot icon in the Toolbar.
- Click Click for Variable List icon in Plot Panel toolbar, select Pressure in the Flow list.
- Click Plot Selected Variables
 icon in the Plot Panel toolbar.
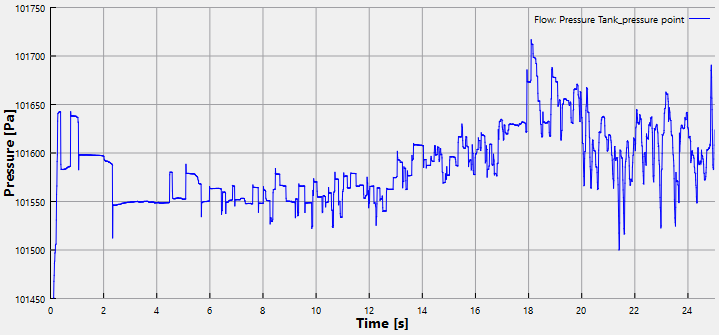
Figure 11.125 - Tank pressure