Plots
This section shows some of the common plots used in the simulation. The steps to create the plots are:
- Click Load Results in the Simulation Panel.
- Select the required result file in the ensuing Load Results dialog box, click Open.
Pressure Force and Shear Force
The Pressure force and Shear Force acting on the Cylinder are monitored by plotting the Pressure Force Y and Shear Force Y as follows:
- Select vortex_shedding_cylinder under Boundaries in the Geometric Entities Panel.
- Click Add XY-Plot
 in the Toolbar.
 - Click Click for Variable List
 icon in the Plot Panel toolbar and then select Pressure Force Y from Flow list.
 - Click Plot Selected Variables
 icon.
icon. - Select Shear Force Y under Flow and click Plot Selected Variables icon.
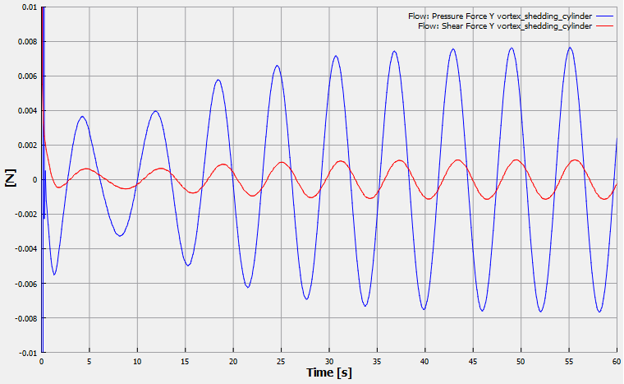
Figure 11.235 - Pressure Force Y and Shear Force Y