|
You are here: Automotive Templates and Tutorials > Automotive Tutorials > Dual Heat Exchanger Tutorial > Plots
|
Plots
This section shows some of the common plots used in the dual heat exchanger simulation.
The steps to create the plots are:
- Click Load Results in the Simulation Panel.
- Select the required result file in the ensuing Load Results dialog box, click Open.
Results - Specified inlet temperature
The plots for specified inlet temperature simulation are created after loading the dual_hx_model_inlet_temp.sres result file.
Temperature of air
The inlet and outlet temperature of air are monitored with the following plots.
- Select air_inlet and air_outlet under Boundaries in the Geometric Entities Panel.
- Click Add XY-Plot
 icon in the Toolbar.
 - Click Click for Variable List
 icon in the Plot Panel toolbar.
 - Select Temperature under Heat and click Plot Selected Variables
 icon.
icon.
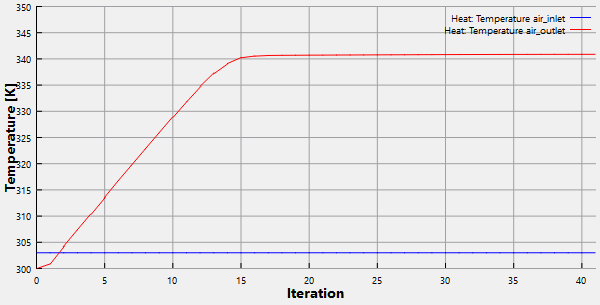
Figure 7.334 - Temperature of air
Temperature of coolant
The inlet and outlet temperature of coolant are monitored with the following plots.
- Select coolant_inlet and coolant_outlet under Boundaries in the Geometric Entities Panel.
- Click Add XY-Plot icon in the Toolbar.
- Click Click for Variable List icon in the Plot Panel toolbar.
- Select Temperature under Heat and click Plot Selected Variables icon.
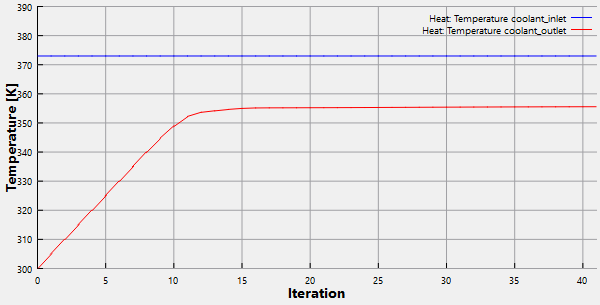
Figure 7.335 - Temperature of coolant
Heat flux
Heat balance is achieved, when the heat gained by air is equal to the heat rejected by coolant, which is monitored with heat flux plots.
- Select air_inlet and air_outlet under Boundaries of radiator Volumes in the Geometric Entities Panel.
- Click Add XY-Plot icon in the Toolbar.
- Click Click for Variable List icon in the Plot Panel toolbar, select Total Flux under Heat.
- Click Combine Entity Data into a Single Curve
 icon to obtain the net heat flux through the Boundaries.
 - Select coolant_inlet and coolant_outlet under Boundaries of radiator_linked Volumes in the Geometric Entities Panel.
- Click Click for Variable List icon in the Plot Panel toolbar, select Total Flux under Heat.
- Click Combine Entity Data into a Single Curve icon to obtain the net heat flux through the Boundaries.
- Select air_inlet, air_outlet, coolant_inlet and coolant_outlet under Boundaries of radiator and radiator_linked Volumes in the Geometric Entities Panel.
- Click Combine Entity Data into a Single Curve icon to obtain the net heat flux through the Boundaries.
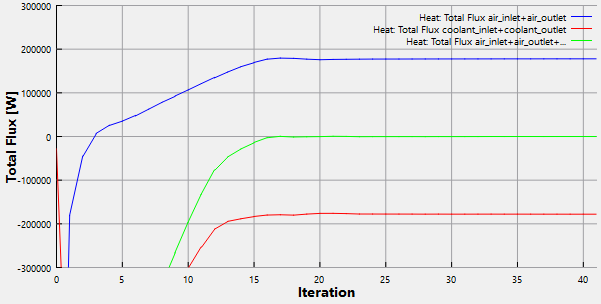
| ´ | Note: The output for the specified inlet temperature simulation can be obtained from the heat flux plot, heat rejection rate = 178000 W see, Figure 7.336. |
Results - Specified heat rejection
The above plots can also be created for the specified heat rejection simulation after loading the dual_hx_model_heat_rej.sres result file.
Temperature of coolant
The inlet and outlet temperature of coolant are monitored with the following plots.
- Select coolant_inlet and coolant_outlet under Boundaries in the Geometric Entities Panel.
- Click Add XY-Plot icon in the Toolbar.
- Click Click for Variable List icon in the Plot Panel toolbar.
- Select Temperature under Heat and click Plot Selected Variables icon.
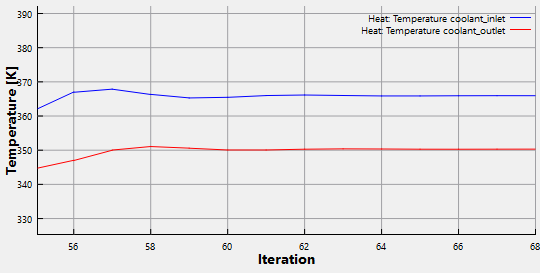
| Note: The output for the specified heat rejection simulation can be obtained from the coolant temperature plot, coolant inlet temperature = 366 K see, Figure 7.337. |