|
You are here: Automotive Templates and Tutorials > Vehicle Template > Vehicle Underhood Thermal Tutorial > Plots
|
Plots
This section shows some of the common plots used in the simulation. The steps to create the plots are:
- Click Load Results in the Simulation Panel.
- Select the required result file in the ensuing Load Results dialog box, click Open.
Mass Flux Across the Radiator (Air)
- Select MGI01_radiator_dir3_min_radiator_veh_dir3_min under Boundaries in the Geometric Entities Panel.
- Click Add XY-Plot
 icon in the Toolbar.
 - Click Click for Variable List
 icon in the Plot Panel, select Mass Force from Flow list in the Plot Panel.
 - Select Plot Selected Variables
 icon > click Plot Property
 icon.
icon. - In the Plot Property dialog box, enable Moving Average and enter 100, click OK.
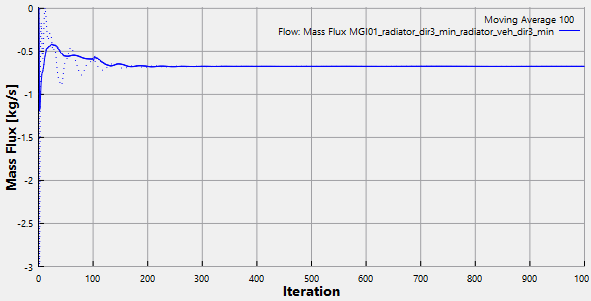
Figure 7.71 - Mass Flux across Radiator
Temperature Across the Radiator (Air)
- Select MGI01_radiator_dir3_min_radiator_veh_dir3_min and MGI02_radiator_dir3_max_radiator_veh_dir3_max under Interfaces in the Geometric Entities Panel.
- Click Add XY-Plot icon in the Toolbar.
- Click Click for Variable List icon in the Plot Panel, select Temperature from Heat list in the Plot Panel.
- Select Plot Selected Variables icon > click Plot Property icon.
- In the Plot Property dialog box, enable Moving Average, enter 100 and change Display Unit to C, click OK.
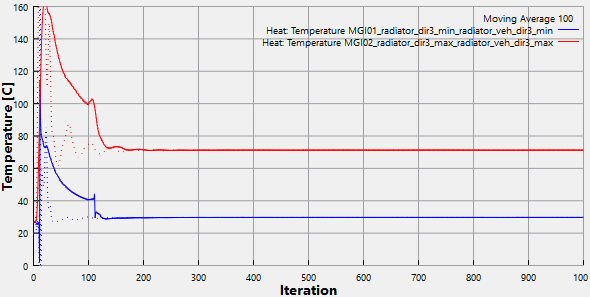
Figure 7.72 - Air temperature across Radiator
Temperature Across the Radiator (Coolant)
- Select radiator_dir1_min_linked and radiator_dir1_max_linked under Boundaries in the Geometric Entities Panel.
- Click Add XY-Plot icon in the Toolbar.
- Click Click for Variable List icon in the Plot Panel, select Temperature from Heat list in the Plot Panel.
- Select Plot Selected Variables icon > click Plot Property icon.
- In the Plot Property dialog box, enable Moving Average, enter 100 and change Display Unit to C, click OK.
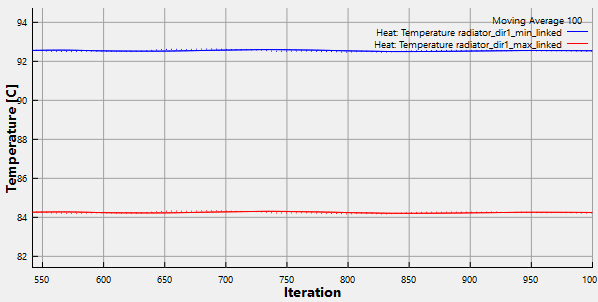
Figure 7.73 - Coolant temperature across radiator
Exhaust Outlet Temperature
- Select exhaust_outlet_1_outlet and exhaust_outlet_2_outlet under Interfaces in the Geometric Entities Panel.
- Click Add XY-Plot icon in the Toolbar.
- Click Click for Variable List icon in the Plot Panel, select Temperature from Heat list in the Plot Panel.
- Select Plot Selected Variables icon > click Plot Property icon.
- In the Plot Property dialog box, enable Moving Average, enter 100 and change Display Unit to C, click OK.
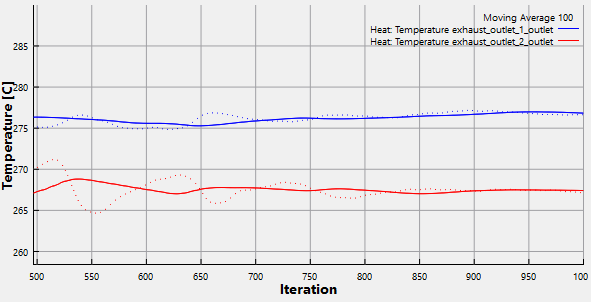
Figure 7.74 - Exhaust Outlet Temperature
Fuel Tank Max Temperature
- Select fuel_tank under Interfaces in the Geometric Entities Panel.
- Click Add XY-Plot icon in the Toolbar.
- Click Click for Variable List icon in the Plot Panel, select Max. Temperature from Heat list in the Plot Panel.
- Select Plot Selected Variables icon > click Plot Property icon.
- In the Plot Property dialog box, enable Moving Average, enter 100 and change Display Unit to C, click OK.
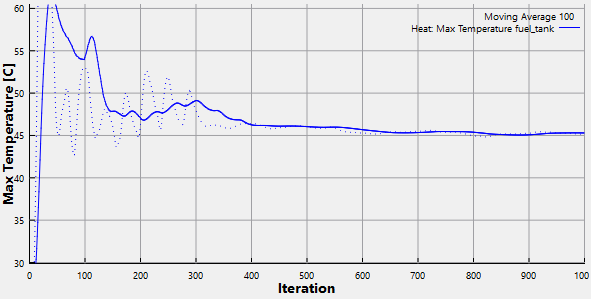
Figure 7.75 - Fuel Tank Maximum Temperature