|
You are here: Additional Templates and Tutorials > Data Exchange Module and Tutorial > Data Exchange Module Tutorial > Plots
|
Plots
The steps to create the plots are:
- Click Load Results in the Simulation Panel.
- Select the required result file in the ensuing Load Results dialog box, click Open.
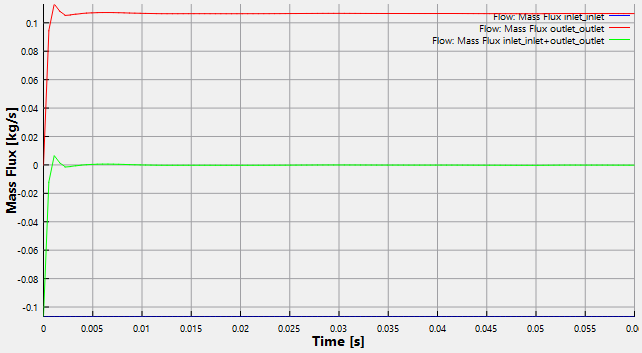
Mass Flux
The fluid flow volume balance is monitored with the mass flux plots.
- Select inlet_inlet and outlet_outlet under Boundaries in the Geometric Entities Panel.
- Click Add XY-Plot
 icon in the Toolbar.
 - Click Click for Variable List
 icon and select Mass Flux under Flow list in the Plot Panel.
 - Click Combine Entity Data into a Single Curve
 to obtain the net mass flux.