|
You are here: Additional Templates and Tutorials > Data Exchange Module and Tutorial > Data Exchange Module Tutorial > Plots
|
Plots
This section shows some of the common plots used in the data exchange simulation. The steps to create the plots are:
- Click Load Results in the Simulation Panel.
- Select the required result file in the ensuing Load Results dialog box, click Open.
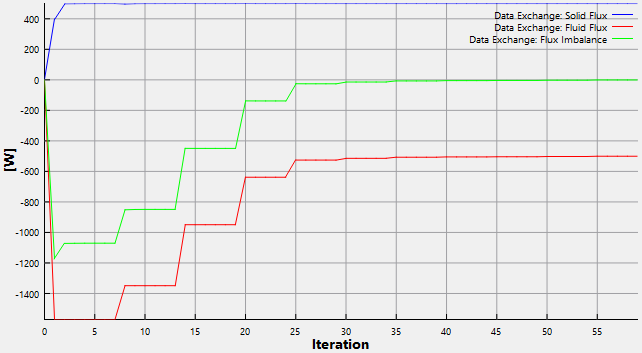
Heat Flux
The heat balance is monitored with the plots.
- Click Add XY-Plot
 icon in the Toolbar.
 - Select Data Exchange in the Model Panel.
- Select Solid Flux, Fluid Flux, Flux Imbalance in the Plot Panel.
- Click Plot Selected Variables
 icon in the Plot Panel.
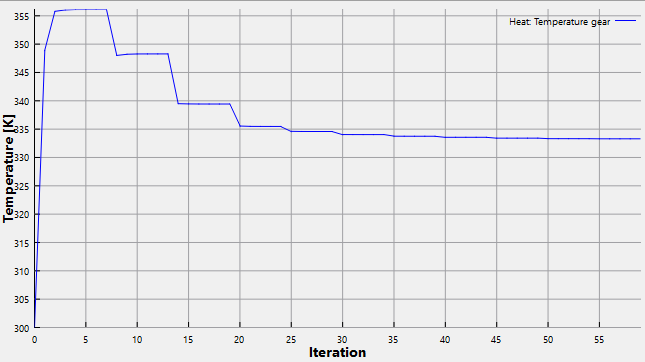
Temperature Converging History
The following plot shows temperature converging history of solid. They are obtained as follows:
- Select gear Volume in the Geometric Entities Panel.
- Click Add XY-Plot icon in the Toolbar.
- Click Click for Variable List
 icon and select Temperature under Heat in the Plot Panel.
 - Click Plot Selected Variables icon in the Plot Panel.