|
You are here: Fluid Machinery Templates and Tutorials > Centrifugal Pump > Turbo Postprocessor module > Display Variables
|
Display Variables
To display contours and vectors on meridional or cascade plots, follow the steps mentioned below.
Display Contours
|
|
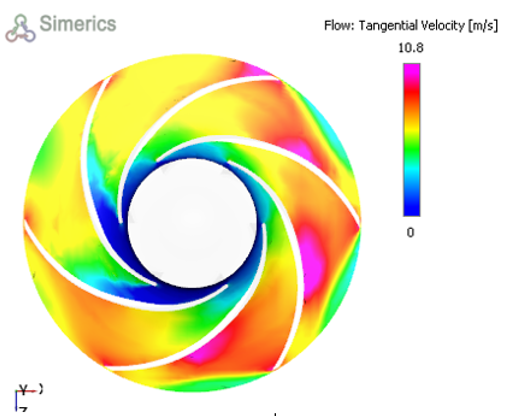
Figure 6.63 - Tangential velocity contours on Cascade plane (centrifugal rotor) |
Display Vectors
- Select Turbo Postprocessor under the Geometric Entities Panel.
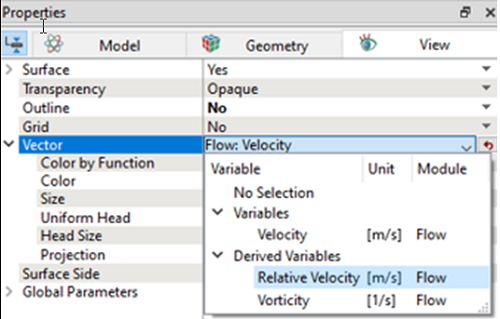
- Enable Vectors in the Results Panel.
- Click View Tab in the Properties Panel.
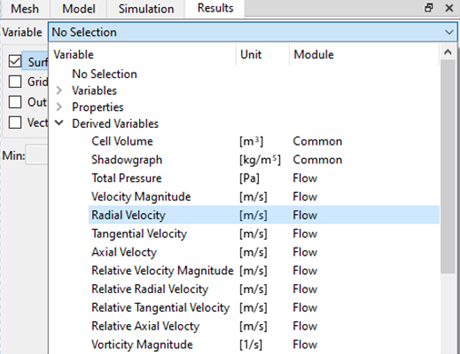
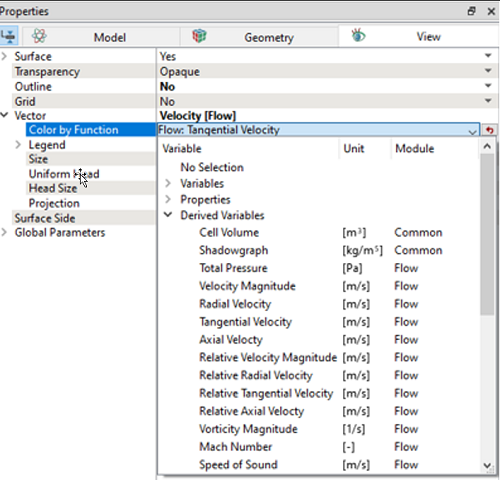
- Select a Variable to display on the cascade plane under Vector dropdown list as shown in the Figure 6.64. Relative Velocity [m/s] variable is selected to display vectors on the cascade plane as shown in the Figure 6.66.
- Select Yes for Projection drop-down list.
- Select a primary or derived variable to display on the vectors under Color By Function dropdown list as shown in the Figure 6.65.
|
|
|
Figure 6.67 - Relative velocity vector on the cascade plane(2D) – |
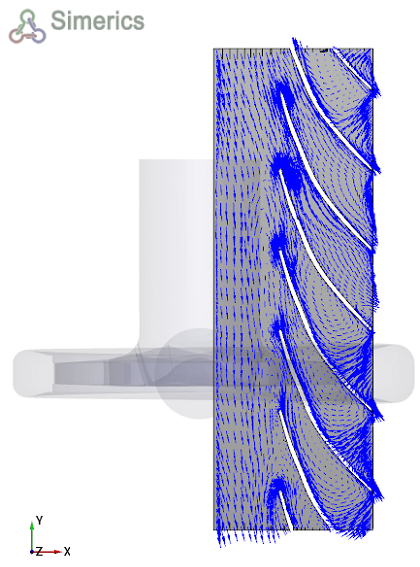
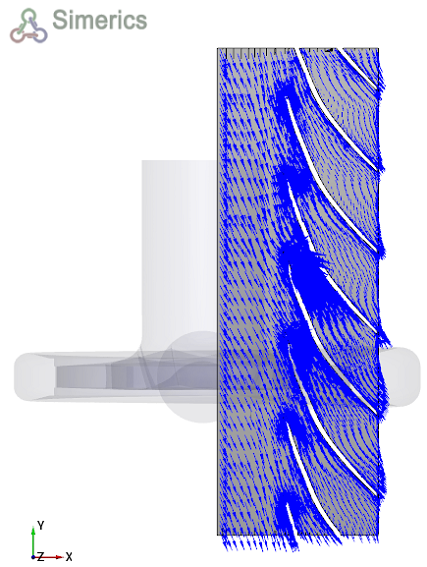
| ´ | Note: Figure 6.66 and Figure 6.67 shows comparison between relative velocity vectors on the cascade plane for centrifugal rotor. Flow separation is observed between blades in low mass flow rate conditions, as shown in Figure 6.66. |