|
You are here: Automotive Templates and Tutorials > Automotive Tutorials > Planetary Gearbox Tutorial > Plots
|
Plots
This section shows some of the common plots used in the planetary gearbox simulation. The steps to create the plots are:
- Click Load Results in the Simulation Panel.
- Select the required result file in the ensuing Load Results dialog box, click Open.
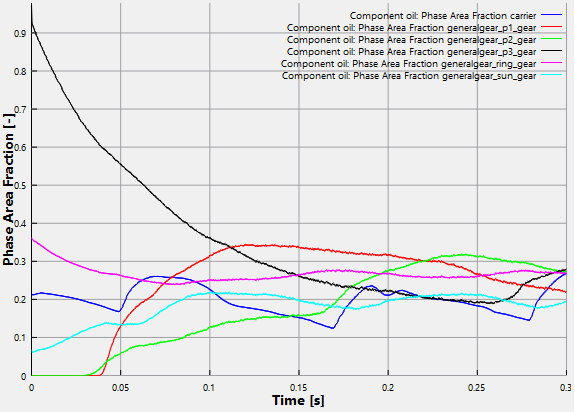
Phase Area Fraction
The oil phase area fraction is plotted as follows:
- Select carrier, generalgear_p1_gear, generalgear_p2_gear, generalgear_p3_gear, generalgear_sun_gear and generalgear_ring_gear under Boundaries in the Geometric Entities Panel.
- Click Add XY-Plot
 icon in the Toolbar.
 - Click Click for Variable List
 icon, select Phase Area Fraction for Component oil list.
 - Click Plot Selected Variables
 icon.
icon.
Power
The instantaneous integrated power about the axis of rotation for all the gears and carrier boundaries are plotted. The power is computed based on the instantaneous integrated torque and the rotation speed.
To create the plot for the power:
- Select carrier, generalgear_p1_gear, generalgear_p2_gear, generalgear_p3_gear, generalgear_sun_gear and generalgear_ring_gear under Boundaries in the Geometric Entities Panel.
- Click Add XY-Plot icon in the Toolbar.
- In the Plot Panel, select Power for Multi-component Flow list.
- Click Plot Selected Variables icon to obtain power.
- Click Plot Property
 icon. In the Plot Property dialog box, specify 1 W for Maximum and -2 W for Minimum under Display Default Range. Click OK.
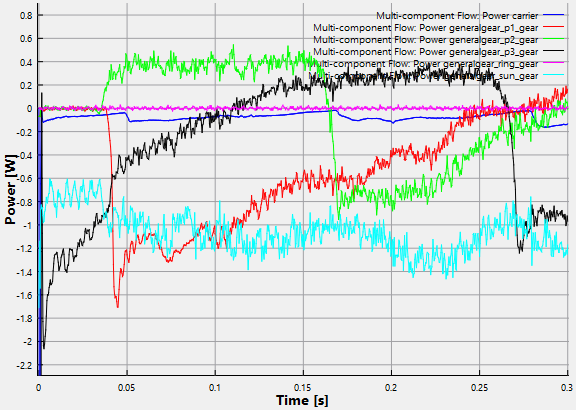
| ´ | Note: Figure 7.215 and Figure 7.216 plots show that the phase area fraction/power at different boundaries is not stabilized for three revolutions of the sun gear. To obtain stable phase area fraction/power, it is recommended to run for few more revolutions (3 more). |