|
You are here: Fluid Machinery Templates and Tutorials > Scroll Compressor > Scroll Compressor Tutorial > Plots
|
Plots
This section shows some of the common plots used in the compressor simulation. The steps to create the plots are:
- Click Load Results in the Simulation Panel.
- Select the required result file in the ensuing Load Results dialog box, click Open.
Mass Flux
The mass balance is monitored with the mass flux plots.
- Select inlet_inlet and outlet_outlet under Boundaries in the Geometric Entities Panel.
- Click Add XY-Plot
 icon in the Toolbar.
 - Click Click for Variable List
 icon, select Mass Flux under Flow in the Plot Panel.
 - Select Plot Selected Variables
 icon > click Plot Property
  icon. In the Plot Property dialog box enable Moving Average and enter 120, click OK.
 - Click Combine Entity Data into a Single Curve
 to obtain the net mass flux.
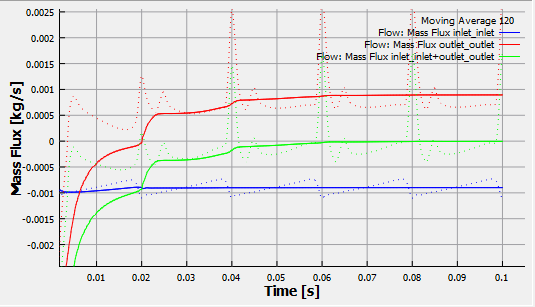
Figure 6.832 - Mass flux
|
Note: The moving average is used in transient simulations to obtain the average behavior over the entire simulation time. It can be specified as, click Click for Variable List |
Pressure
The pressure ripples are monitored at the monitoring points Outlet_pressure_point. They are obtained as follows:
- Select Outlet_pressure_point under Points in the Geometric Entities Panel.
- Click Add XY-Plot icon in the Toolbar.
- Click Click for Variable List
 icon in Plot Panel toolbar, select Pressure from Flow list.
 - Click Plot Selected Variables icon.
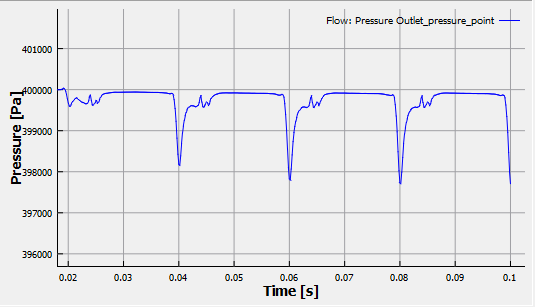
Figure 6.833 - Pressure
Pocket Averaged Pressure
The pocket averaged pressure is monitored at the Pocket_point. It is obtained as follows:
- Select Pocket_point under Points in the Geometric Entities Panel.
- Click Add XY-Plot icon in the Toolbar.
- Click Click for Variable List icon in Plot Panel toolbar, select Pocket Averaged Pressure from Scroll list.
- Click Plot Selected Variables icon.
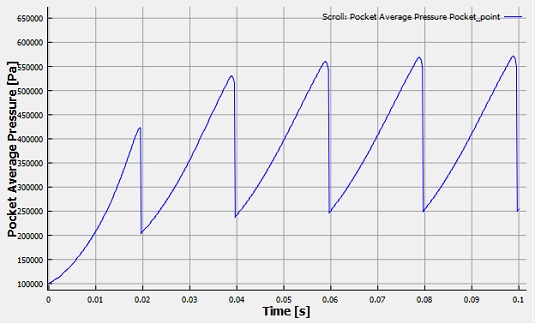
Figure 6.834 - Pocket averaged pressure
| ´ | Note: To plot pocket averaged pressure vs pocket volume, copy the data from plot panel and paste it in the spread sheet. |
Power
The instantaneous integrated power about the axis of rotation for the inner, outer rotor or rotating port is plotted. The power is computed based on the instantaneous integrated torque and the rotation speed.
To create the plot for the revolution average power:
- Select rotor_tip and scroll_rotor under Boundaries in the Geometric Entities Panel.
- Click Add XY-Plot icon in the Toolbar.
- In the Plot Panel, select Revolution Average Power for Scroll list.
- Click Combine Entity Data into a Single Curve icon in the bottom left of Plot Panel, to obtain the net power.
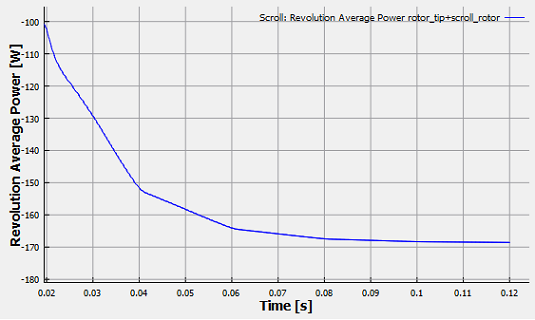
Figure 6.835 - Revolution average power
| Note: To get the stable revolution average power, perform the simulation for six revolution. |