3.7 Plot Panel
The Plot Panel is used to display Primary Variables, Property Variables and Derived Variables at a point; and integrated output corresponding to Boundaries, Derived Surfaces and Interfaces in X-Y Plots. The Plot Panel is activated by clicking Add X-Y Plot ![]() in the . For example, refer Post Processing-XY Plot.
in the . For example, refer Post Processing-XY Plot.
The menus/icons in the Plot Panel are shown below:
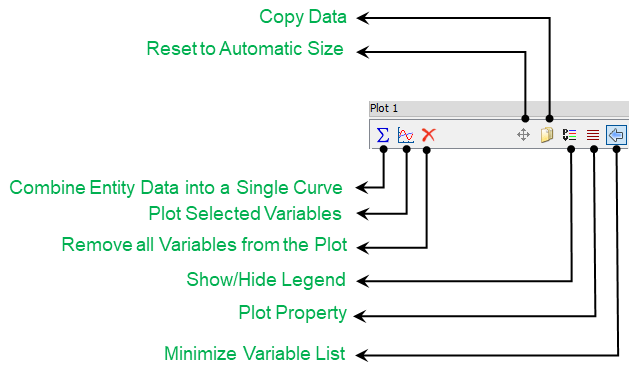
Figure 3.31 - Plot panel
- Combine Entity Data into a Single Curve (Plot Together): The data available for a group of selected geometric entities is summed and plotted as a single curve. For example, to plot Mass Flux at inlet and outlet can be summed and plotted as single curve using Combine Entity Data into a Single Curve icon
 .
. - Plot Selected Variables (Individually): Plots the X-Y plot for selected geometric entities and variable of interest using Plot Selected Variables icon
 .
. - Remove: Curves may be removed from the Plot Panel using the Remove All Variables from Plot Icon
 .
. - Reset to Automated Size: The range and position of the curves can be automatically set using this icon
 .
. - Copy Data: The data in a plot may be copied and pasted into a spread sheet, such as Excel® using the Copy Data Icon
 .
. - Show / Hide Legend: The Legend in the Plot Panel may be toggled on or off using the Show / Hide Legend Icon
 .
.
|
Note: Double click with the Left Mouse also resets the scale. |
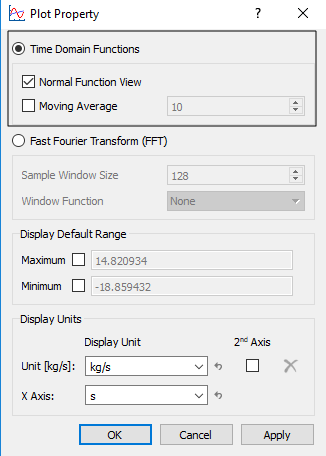
Plot PropertyThe Plot Property dialog box offers the following options for plotting and displaying data: Time Domain Functions
|
Figure 3.32 - Plot property |
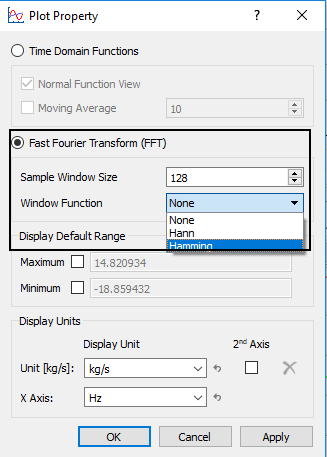
Fast Fourier Transform (FFT)This displays a fourier transform of the data. The FFT window options are:
Display Default RangeAllows to explicitly set the Minimum and Maximum range of the X-Y Plots.
Display UnitsAllows to select the units used in the X-Y Plot. 2nd Axis: Allows to add a 2nd axis in the X-Y Plot.
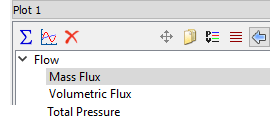
Variable ListList of variables available to plot for a selected geometric entity. The output variables for a particular boundary are listed under output variable of the modules. Minimize Variable List: Minimizes the variable list by clicking the icon
|
Figure 3.33 - Fast Fourier Transform
Figure 3.34 - Variable list |
Zoom the plot
The curves in the Plot Panel can be zoomed in and out using the mouse.
The manipulations include the following options:
- Pan: Right Mouse Button
- Zoom: Roll Middle Mouse Button
- Reset: Double Click Left Mouse Button
- Lasso: Drag Left Mouse Button. The Lasso expands a plot about the selected rectangle. (To return to the full range, the user can double-click on the plot with the Left Mouse Button).
|
Note: When using the Copy Data Icon |