Plots
This section shows some of the common plots used in the cyclone separator simulation. The steps to create the plots are:
- Click Load Results in the Simulation Panel and load the steady state results.
- Select the required result file in the ensuing Load Results dialog box, click Open.
Mass Flux
The mass balance is monitored with the mass flux plots.
- Select Cyclone_inlet and Cyclone_outlet under Boundaries in the Geometric Entities Panel.
- Click Add XY-Plot
 in the Toolbar.
 - Click Click for Variable List
 and then select Mass Flux under Flow in the Plot Panel.
 - Click Plot Selected Variables
 .
. - Click Combine Entity Data into a Single Curve
 to obtain the net mass flux.
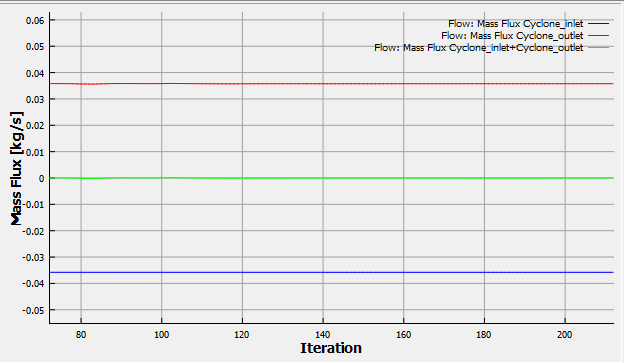
Figure 11.23 - Mass flux
Pressure
The pressure is monitored at the monitoring points Center_point and Bin_point. They are obtained as follows:
- Select Center_point and Bin_point under Points in the Geometric Entities Panel.
- Click Add XY-Plot in the Toolbar.
- Click Click for Variable List
 in Plot Panel toolbar and then select Pressure from Flow list.
 - Click Plot Selected Variables .
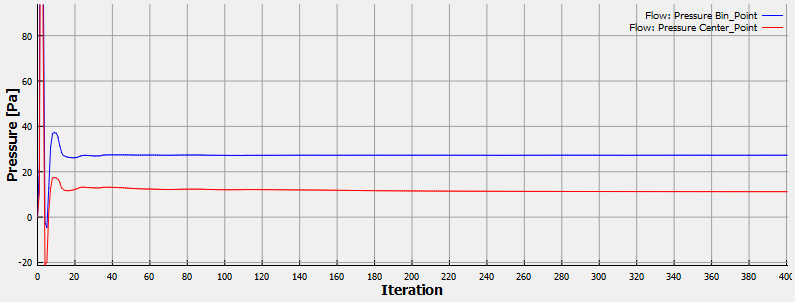
Figure 11.24 - Pressure