Plots
This section shows some of the common plots used in the turbulent flow in a diffuser simulation. The steps to create the plots are:
- Click Load Results in the Simulation Panel and load the steady state results.
- Select the required result file in the ensuing Load Results dialog box, click Open.
-
Select Point 1 to Point 10 under Points in the Geometric Entities Panel.
-
Click Click for Variable List
 and then select Pressure under Flow in the Plot Panel.
 - Click Plot Selected Variables
 .
.
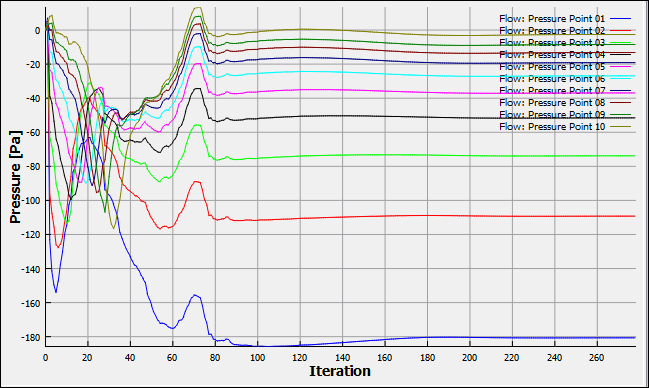
Figure 11.275 - Pressure at Monitoring points
Plotting the pressure at monitoring point 10 ( Diffuser outlet pressure)
-
Select Point 10 under Points in the Geometric Entities Panel.
- Click Add XY-Plot
 in the Toolbar.
 - Click Click for Variable List and then select Pressure under Flow in the Plot Panel.
- Click Plot Selected Variables .
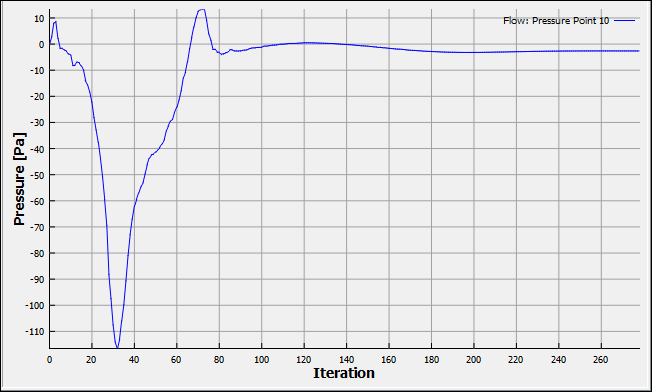
Figure 11.276 - Pressure at monitoring point 10
|
Note: Pressure at monitoring point 10 is monitored, which is very close to the diffuser outlet and this is used for calculation of coefficient of pressure. Refer to validation section. |