Plots
This section shows some of the common plots used in the mixing tank simulation. The steps to create the plots are:
- Click Load Results in the Simulation Panel.
- Select the required result file in the ensuing Load Results dialog box, click Open.
Volume Weighted Uniformity Index Species
- Click Add XY-Plot
 icon in the Toolbar to create Plot 1.
 - Select Common in the Model Panel.
- Click Click for Variable List
 icon in the Plot Panel toolbar and select Volume Weighted Uniformity Index Species under Common.
 - Click Plot Selected Variables
 icon.
icon.
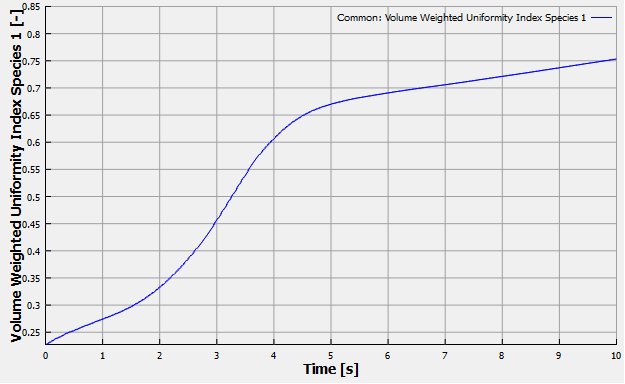
Figure 11.297 - Volume Weighted Uniformity Index Species 1