Plots
This section shows some of the common plots used in the erosion model simulation. The steps to create the plots are:
- Click Load Results in the Simulation Panel and load the final transient results.
- Select the required result file in the ensuing Load Results dialog box, click Open.
Mass Flux
The mass balance is monitored with the mass flux plots.
- Select inlet_inlet and outlet_outlet under Boundaries in the Geometric Entities Panel.
- Click Add XY-Plot
 in the Toolbar.
 - Click Click for Variable List
 and then select Mass Flux under Flow in the Plot Panel.
 - Click Plot Selected Variables
 .
. - Click Combine Entity Data into a Single Curve
 to obtain the net mass flux.
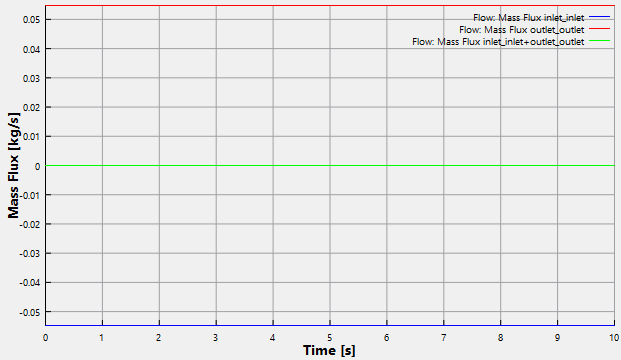
Figure 11.324 - Mass flux
Erosion Speed
- Select elbow_wall under Boundaries in the Geometric Entities Panel.
- Click Add XY-Plot in the Toolbar.
- Click Click for Variable List
 in Plot Panel toolbar and then select Erosion Speed from Particle list.
 - Click Plot Selected Variables .
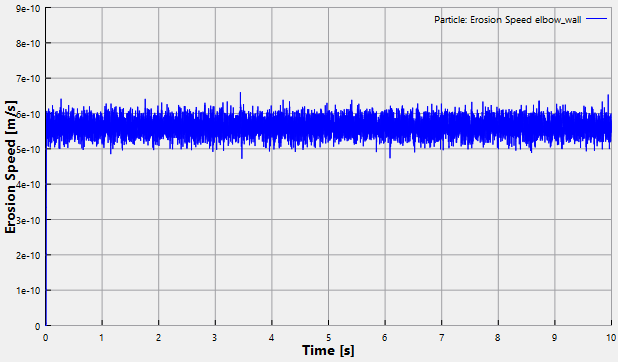
Figure 11.325 - Erosion Speed
Erosion Mass
- Select elbow_wall under Boundaries in the Geometric Entities Panel.
- Click Add XY-Plot in the Toolbar.
- Click Click for Variable List in Plot Panel toolbar and then select Erosion Mass from Particle list.
- Click Plot Selected Variables .
- Click Plot Property
 icon, the Plot Property dialog box opens. Select g under Unit drop-down list of Display Unit.
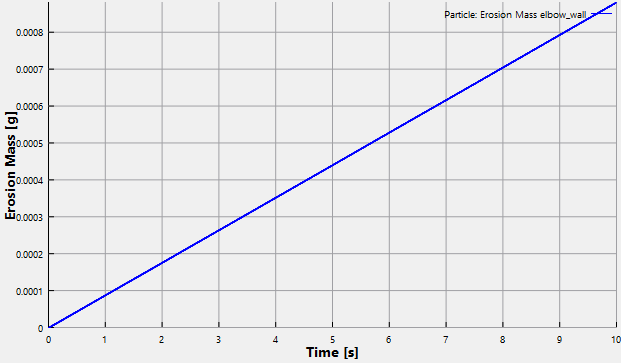
Figure 11.326 - Erosion Mass
Erosion Thickness
- Select elbow_wall under Boundaries in the Geometric Entities Panel.
- Click Add XY-Plot in the Toolbar.
- Click Click for Variable List in Plot Panel toolbar and then select Erosion Thickness from Particle list.
- Click Plot Selected Variables .
- Click Plot Property icon, the Plot Property dialog box opens. Select um under Unit drop-down list of Display Unit.
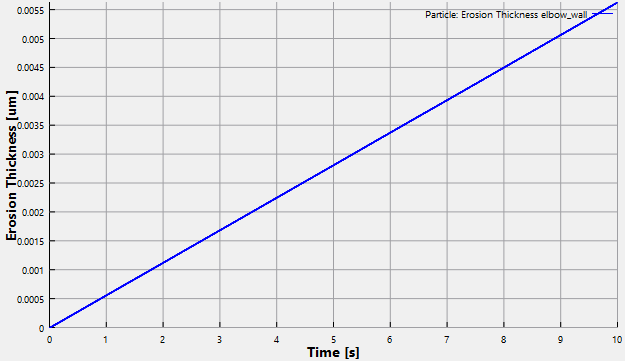
Figure 11.327 - Erosion Thickness
Erosion Mass Rate
- Select elbow_wall under Boundaries in the Geometric Entities Panel.
- Click Add XY-Plot in the Toolbar.
- Click Click for Variable List in Plot Panel toolbar and then select Erosion Mass Rate from Particle list.
- Click Plot Selected Variables .
- Click Plot Property icon, the Plot Property dialog box opens. Type as kg/h under Unit drop-down list of Display Unit.
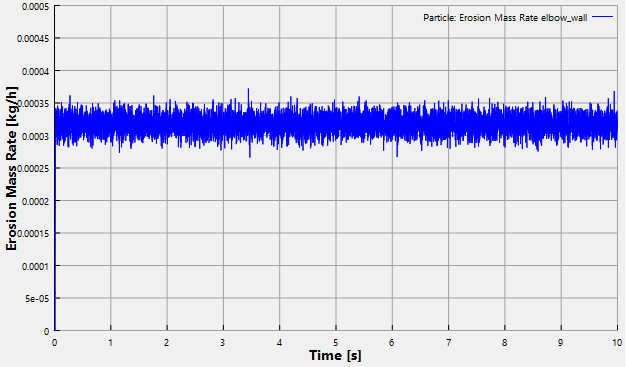
Figure 11.328 - Erosion Thickness