Plots
This section shows some of the common plots from the propeller simulation. The steps to create the plots are:
- Click Load Results in the Simulation Panel.
- Select the required result file in the ensuing Load Results dialog box, click Open.
Power
The power on the propeller is plotted as follows.
- Select propeller under Boundaries in the Geometric Entities Panel.
- Click Add XY-Plot
 icon in the Toolbar.
 - Click Click for Variable List
 icon in the Plot Panel, select Revolution Average Power under Propeller list.
 - Click Plot Selected Variables
 icon.
icon. - Click Plot Property
 icon, the Plot Property dialog box opens.
 - Specify 0 W for Maximum and -1000 W for Minimum under Display Default Range. Click OK.
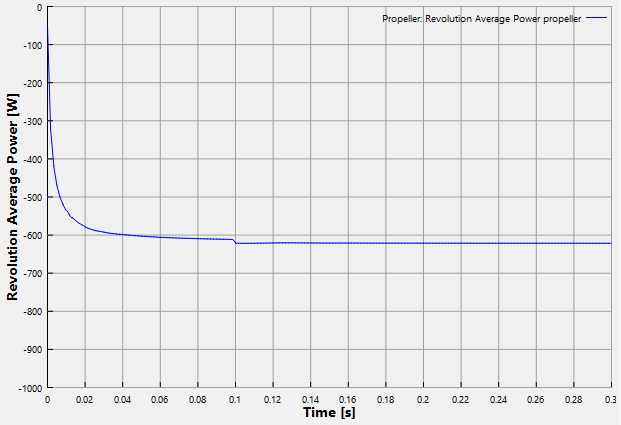
Figure 8.109 - Power on propeller
Torque
To torque on the propeller is plotted as follows:
- Select propeller under Boundaries in the Geometric Entities Panel.
- Click Add XY-Plot icon in the Toolbar.
- Click Click for Variable List icon in the Plot Panel, select Torque under Flow list.
- Click Plot Selected Variables icon.
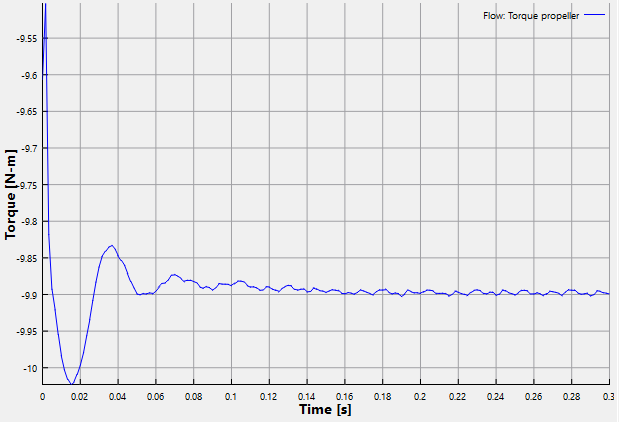
Figure 8.110 - Torque on propeller
Advance Ratio
The calculated advance ratio is plotted as follows:
- Click Add XY-Plot icon in the Toolbar.
- Select Common in the Model Panel.
- Click Click for Variable List icon in the Plot Panel, select Advance Ratio under Common list.
- Click Plot Selected Variables icon.
- Click Plot Property icon, the Plot Property dialog box opens.
- Specify 1 for Maximum and 0 for Minimum under Display Default Range. Click OK.
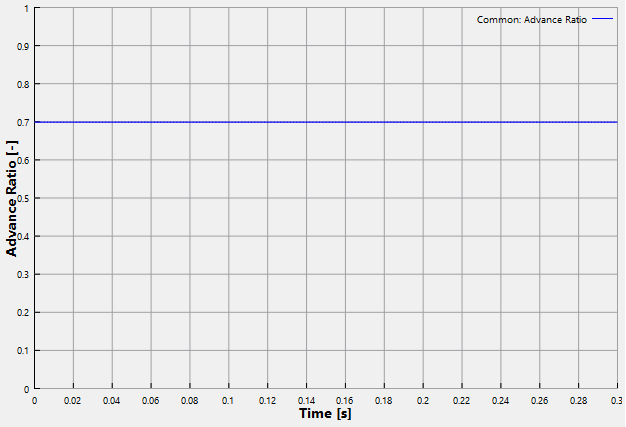
Figure 8.111 - Advance Ratio plot
Torque coefficient
The calculated torque coefficient is plotted as follows:
- Click Add XY-Plot icon in the Toolbar.
- Select Common in the Model Panel.
- Click Click for Variable List icon in the Plot Panel, select KQ under Common list.
- Click Plot Selected Variables icon.
- Click Plot Property icon, the Plot Property dialog box opens.
- Specify -0.03 for Maximum and -0.04 for Minimum under Display Default Range. Click OK.
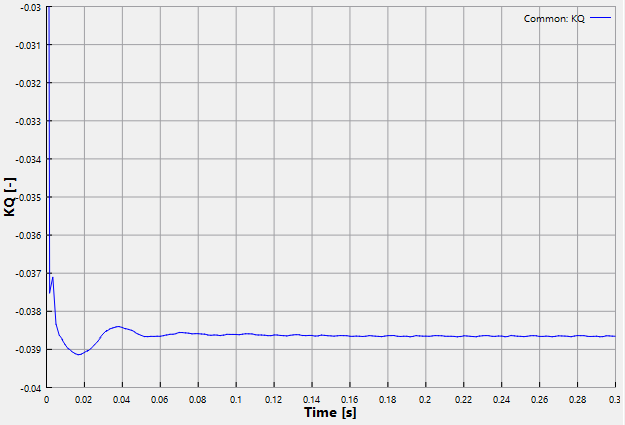
Figure 8.112 - Torque coefficient plot
Thrust coefficient
The calculated thrust coefficient is plotted as follows:
- Click Add XY-Plot icon in the Toolbar.
- Select Common in the Model Panel.
- Click Click for Variable List icon in the Plot Panel, select KT under Common list.
- Click Plot Selected Variables icon.
- Click Plot Property icon, the Plot Property dialog box opens.
- Specify -0.1 for Maximum and -0.3 for Minimum under Display Default Range. Click OK.
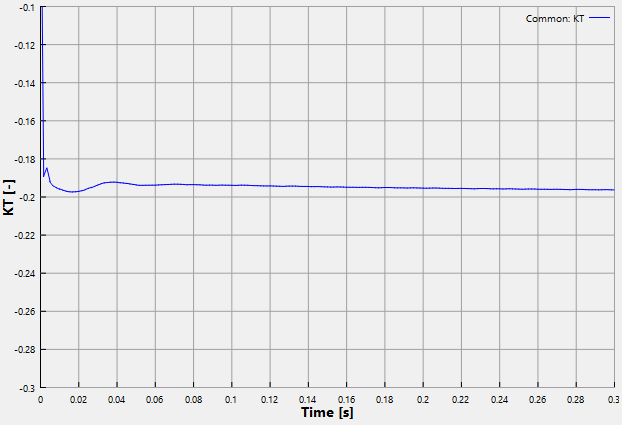
Figure 8.113 - Thrust coefficient plot