|
You are here: Additional Templates and Tutorials > PID Controller Template and Tutorial > PID Controller Tutorial > Plots
|
Plots
This section shows plots obtained from results of mixing pipe of PID controller simulation. The steps to create the plots are:
- Click Load Results in the Simulation Panel.
- Select the pid_controller.sres result file in the ensuing Load Results dialog box, click Open.
Control Variable
The control variable is monitored till the stable set point value is achieved.
- Click Add XY-Plot
 icon in the Toolbar.
 - Click Click for Variable List
 icon, select Control Variable under Controller heat in the Plot Panel.
 - Click Plot Selected Variables
 icon to obtain the control variable.
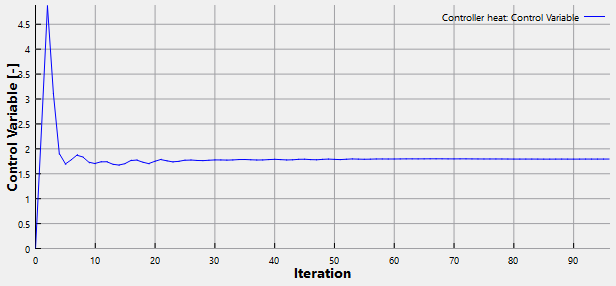
Figure 10.78 - Control variable
Error
The error value at outlet is monitored to check error value at each iteration, which is reducing with desired set point value. It is obtained as follows:
- Click Add XY-Plot icon in the Toolbar.
- Click Click for Variable List
 icon in Plot Panel toolbar, select Error under Controller heat in the Plot Panel.
 - Click Plot Selected Variables icon to obtain the error value at outlet.
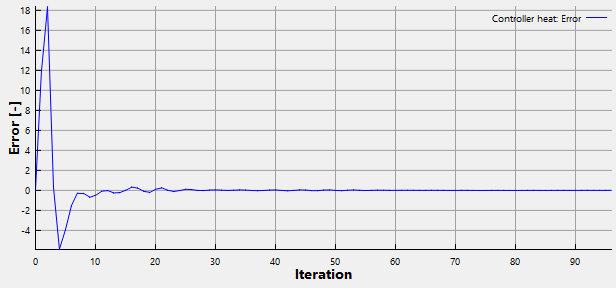
Figure 10.79 - Error
| Note: The above plot shows difference in calculated temperature and set point value as error value at each iteration. |
Outlet Temperature
The temperature is monitored at pipe outlet. It is obtained as follows:
- Select pipe_outlet under Boundaries in the Geometric Entities Panel.
- Click Add XY-Plot icon in the Toolbar.
- Click Click for Variable List icon, select Temperature under Heat in the Plot Panel.
- Click Plot Selected Variables icon to obtain the temperature value at outlet.
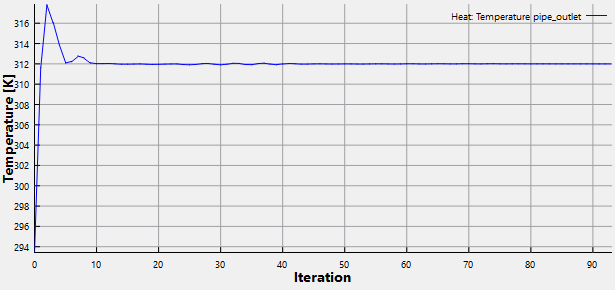
Figure 10.80 - Outlet temperature
Volumetric Flux- Hot fluid Inlet
The flow rate is monitored at hot fluid inlet, which is varying at each iteration till a set point value is achieved. It is obtained as follows:
- Select pipe_hot_inlet under Boundaries in the Geometric Entities Panel.
- Click Add XY-Plot icon in the Toolbar.
- Click Click for Variable List icon, select Volumetric Flux under Flow in the Plot Panel.
- Click Plot Selected Variables icon. In the Plot Property dialog box, select L/min for Units. Click OK.
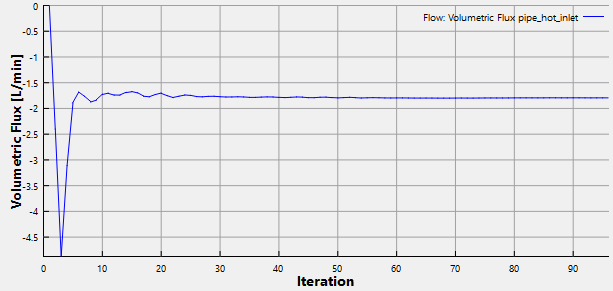
Figure 10.81 - Volumetric flux - Hot fluid inlet