Plots
This section shows some of the common plots used in the simulation. The steps to create the plots are:
- Click Load Results in the Simulation Panel.
- Select the required result file in the ensuing Load Results dialog box, click Open.
Pressure force on car body
The force exerted by the pressure in flow direction over the car body, is monitored by plotting the net Pressure Force X.
- Select Body_Rear_i1, Body_i2, Engine, Engine_1_i1, Engine_1_i2, Exhaust, Grille, Mirror_Cover, Mirrors, Shroud, Underbody_1, Underbody_i2, Underhood_1, Underhood_i2, WindShield_Guard_i1, front_intakes_1, front_intakes_i2, lights_front_i1, radiator_veh_dir3_max, radiator_veh_dir3_min, tyres_fr, tyres_rear, wheels_fr, wheels_rear, windows_1, windows_i1, windows_rear_1 and windows_rear_ i1 under Boundaries in the Geometric Entities Panel.
- Click Add XY-Plot
 icon in the Toolbar.
 - Click Click for Variable List
 icon in the Plot Panel, select Pressure Force X from Flow list.
 - In the Plot Property dialog box, enable Moving Average and enter 100, click OK.
- Click Combine Entity Data into a Single Curve
 icon to obtain the net pressure force in X direction.
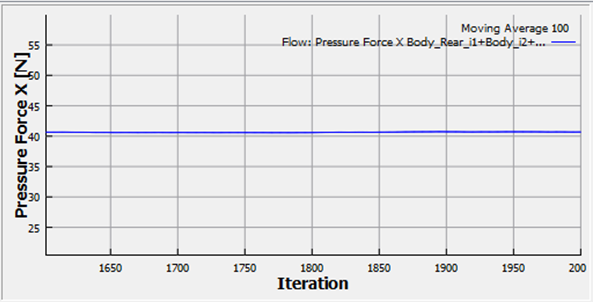
Figure 7.64 - Pressure force X
Volumetric Flux through radiator
The flux is monitored with the volumetric flux plots.
- Select MGI01_radiator_dir3_min_radiator_veh_dir3_min and MGI02_radiator_dir3_max_radiator_veh_dir3_max under Interfaces in the Geometric Entities Panel.
- Click Add XY-Plot icon in the Toolbar.
- Click Click for Variable List icon in the Plot Panel, select Volumetric Flux from Flow list.
- In the Plot Property dialog box, enable Moving Average and enter 100, click OK.
- Click Plot Selected Variables
 icon.
icon.
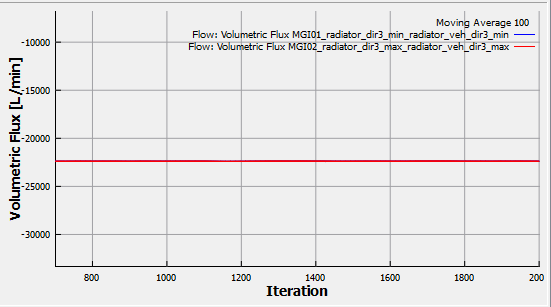
Figure 7.65 - Volumetric Flux through radiator