Plots
The variables of interest in a marine simulation are:
- Total Resistance: Combined resistance for the whole ship, even though the simulation is done for a half model. The resistance is always positive for drag.
- Effective Power: Power required to move the ship hull at a given speed in the absence of propeller action. It overcomes the resistance offered to the motion of the vessel (indicated by Total Resistance).
- Pitch: Pitching motion results in dynamic trim. The sign is universal. Negative is bow-up and positive is bow-down.
- Heave: Heave motion results in dynamic sinkage. The sign is universal. Negative is going down and positive is going up.
- Forward Velocity: Velocity with which the vessel moves forward. Positive indicates forward motion.
The plots for these variables can be obtained by the following steps.
- Click Add XY-Plot
 icon in the Toolbar.
 - Select the Marine in the Model Panel.
- The Variables to be plotted (shown above) can be selected from the Click for Variable List
 icon in the Plot Panel.
Example plots are shown here for a displacement hull propelling to a target velocity of 2.196 m/s with a ramp up time of 4 s.
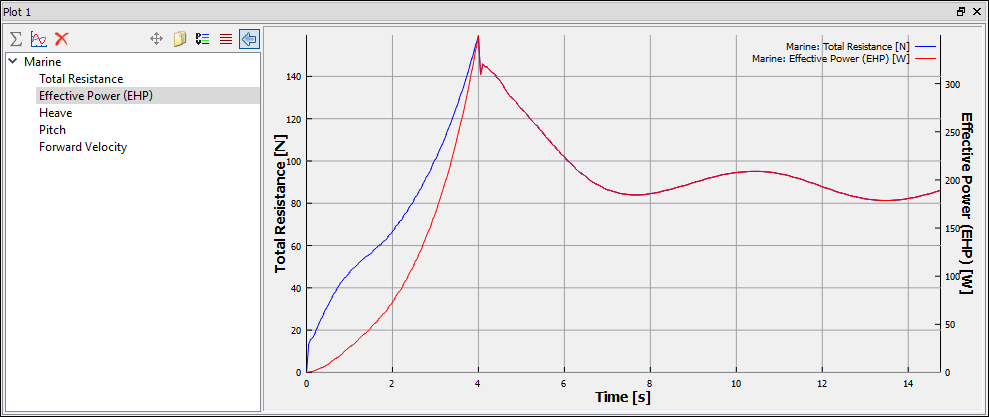
Figure 8.30 - Power and resistance plots
Advanced performance plots
Marine simulation is focused towards studying the seakeeping of the vessel at different speeds. Hence the performance parameters are studied for a wide range of Froude numbers. The following plots obtained from a series of simulations at different Froude numbers give significant insight into the vessel's performance.
Drag coefficient curve: Plots the drag coefficient (CT) at different Froude numbers.
Sinkage curve: Plots the sinkage of the vessel at different Froude numbers. The sinkage is proportional to the translational heave of the vessel.
Trim curve: Plots the trim of the vessel at different Froude numbers. The trim is proportional to the rotational pitch of the vessel.
Examples for the above mentioned plots are shown here for a displacement hull.
| Note: These plots are obtained from the results of multiple displacement hull simulations and are plotted using an external software such as Microsoft Excel |
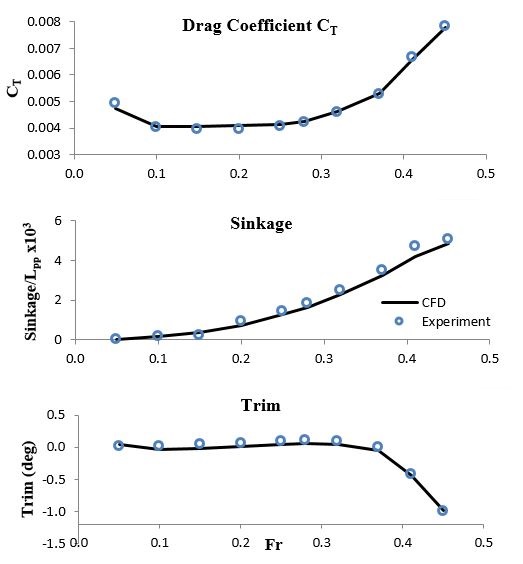
Figure 8.31 - Advanced performance plots (Obtained from external software)
| Note: Plots can also be obtained for the degrees of freedom (DOFs) - Translational & Rotational. |