|
You are here: Optimization Module and Tutorial > Optimization of 2D Shape Tutorial > Post processing > Contours
|
Contours
The Pressure and velocity contours obtained from the results of the baseline case and the optimized case are compared.
|
Note: The baseline case is simulated with only flow module added, assigning fluid properties, boundary and volume conditions and the result file is saved as 2D_shape_optimization_model_baseline.sres in the working directory. |
The steps to create contours are:
- Click Load Results in the Simulation Panel.
- Select the required result file in the ensuing Load Results dialog box, click Open.
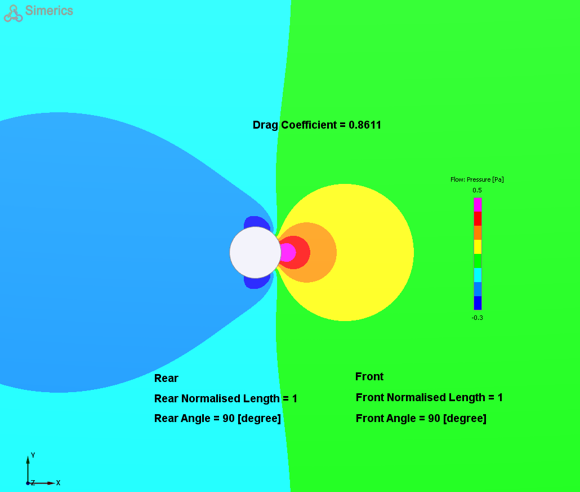
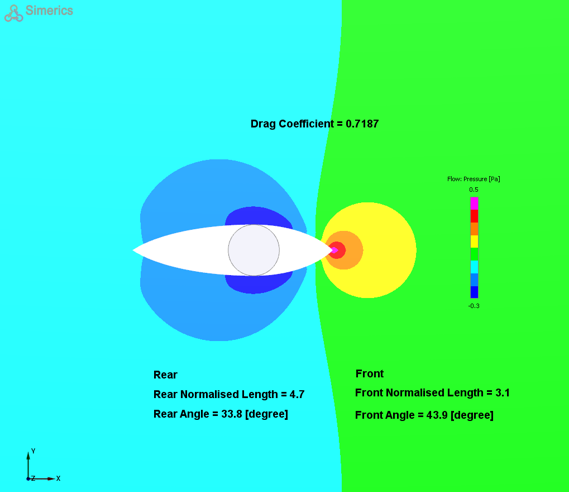
Pressure Contours
- Select annulus from the Volumes in the Geometric Entities Panel.
- Select Pressure from the Variables list under Variable drop-down list in the Results Panel (see, Figure 9.36). For variables and legends, refer Post-Processing.
- In the Properties Panel, navigate to View Tab, select Y from the Mirror dropdown under Global Parameters. It offers to mirror the displayed contour in the selected plane.
- Enter Drag Coefficient = {cd%4f} under Text Label in Global Parameters of View Tab.
- Enter Front under Text Label in Global Parameters of View Tab.
- Enter Rear under Text Label in Global Parameters of View Tab.
- Enter Front Normalised Length = {fl%1f} under Text Label in Global Parameters of View Tab.
- Enter Rear Normalised Length = {rl%1f} under Text Label in Global Parameters of View Tab.
- Enter Front Angle = {ftheta_new%1f} [degree] under Text Label in Global Parameters of View Tab.
- Enter Rear Angle = {rtheta_new%1f} [degree] under Text Label in Global Parameters of View Tab.
- Select all CAD Surfaces, enable Outline in the Results Panel.
- Below is the comparison of pressure between Baseline case and Optimized case (See, Figure 9.36 and Figure 9.37).
|
|
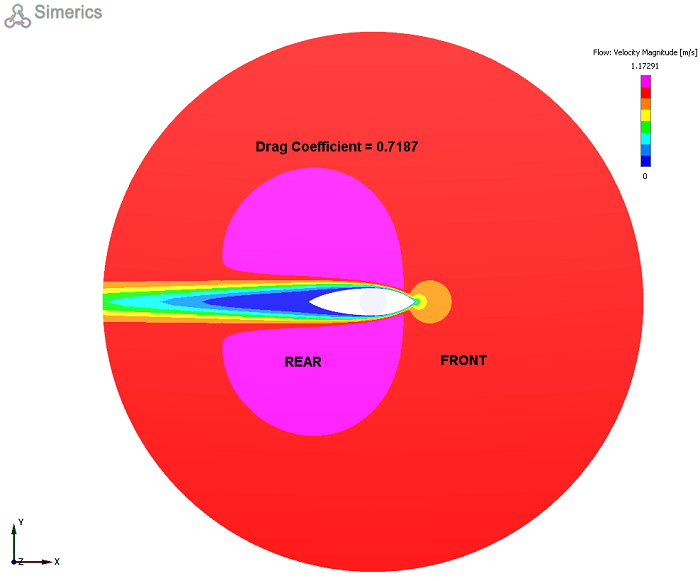
Velocity Contours
- Select annulus from the Volumes in the Geometric Entities Panel.
- Select Velocity Magnitude from the Variables list under Variable drop-down list in the Results Panel see, Figure 9.38. For variables and legends, refer Post-Processing.
- Refer to the Pressure Contour, on how to add Text labels to the Display Panel, as shown in the Figure 9.38.