|
You are here: Optimization Module and Tutorial > Optimization of 2D Shape Tutorial > Post processing > Plots
|
Plots
This section shows the different plots created using text file results after importing into Excel worksheet:
Drag vs Variable
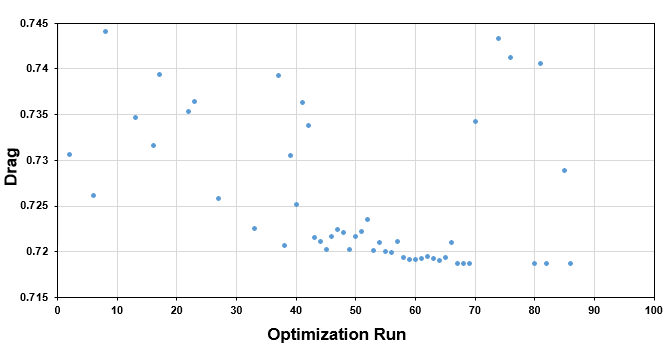
The Drag values are plotted against different variables for all optimizations run. All plots below showcase how variables impact the drag coefficient.
-
Click Insert > Insert Scatter (X,Y) > Scatter Plot.
-
Click the plot, Right-click > Select Data > Add > Enter Series Name as shown in the plot below.
-
Select run (Optimization run) column in the Series X Values and obj1 column in the Series Y Values to get "Drag varying with each optimization run".
- Click new Scatter plot (Follow step1 and step 2).
-
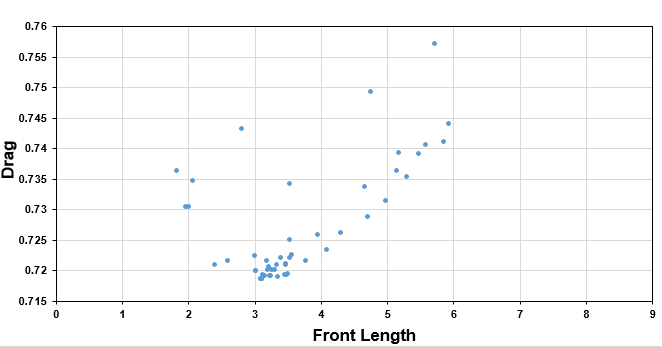
Select fl (Front Length) column in the Series X Values and obj1 column in the Series Y Values to get "Drag vs Front Length" plot.
- Click new Scatter plot (Follow step1 and step 2).
-
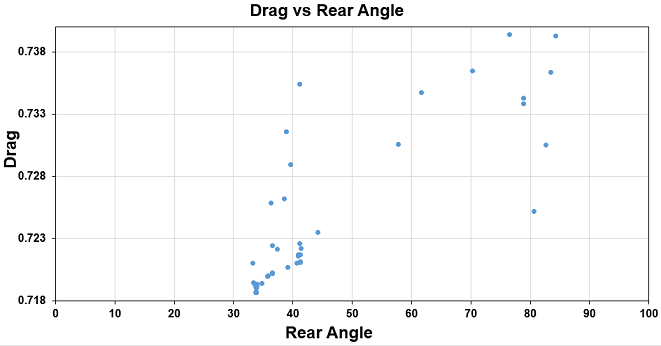
Select fang (Front Angle) column in the Series X Values and obj1 column in the Series Y Values to get "Drag vs Front Angle" plot.
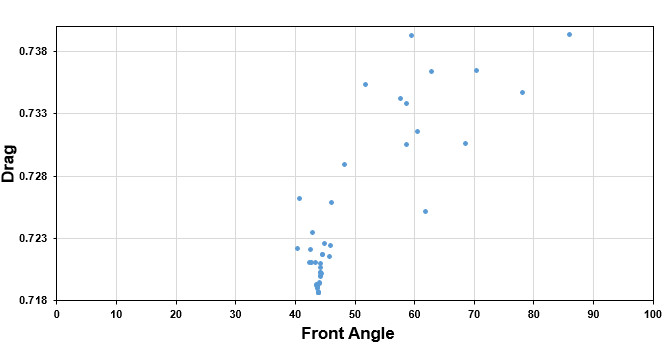
Figure 9.41 - Drag vs Front Angle
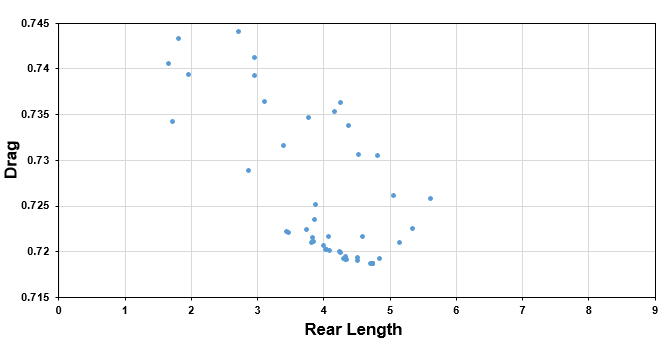
- Similarly, we can show sensitivity of other variables to Drag Coefficient (see, Figure 9.42).