12.8 Display Settings and Save Images
The options available for displaying Surface, Grid, Outline and viewing features (Transparency, Color etc) are set under Properties Panel > View Tab as explained in View tab. Some of the display examples are explained as follows:
To clip sections
Cross-Section can also be used to clip the 3D view in the Display Panel. To clip sections, follow the steps below:
- Select a section under Derived Surfaces of the Geometric Entities Panel.
- Go to Properties Panel > View Tab, select Keep Positive Side under Section option (see, Figure 12.37).
- Select Keep Negative Side under Section option (see, Figure 12.38).
|
|
|


| ´ | Note: All the 3D entities in the Display Panel are clipped. User can use two or more sections to construct a desired clip view. |
To change the appearance of legend bar
When coloring any display object (volume, boundary, streamline etc.) using a variable, a legend bar will be associated with that variable to match the variable values to each individual color. User can change the setting of the legend bar, such as number of colors, color scheme, display of intermediate values, etc.
- Choose desired Boundary/Volume/Section under the Geometric Entities Panel.
- Enable Surface and desired Variable in the Results Panel.
- Select Yes for Show Values under Display Variable in the Properties Panel > View Tab. This displays all the values in the color bar as shown in Figure 12.39.
- Input the desired Number of Colors under Display Variable in the Properties Panel > View Tab. This displays color bar as defined with the required number of colors, see Figure 12.40.
- Select the desired unit for Display Unit under Display Variable in the Properties Panel > View Tab. This displays color bar with the specified unit as shown in Figure 12.41.
|
|
|
|


To display Text
User can add text labels to the Display Panel using the text box for Text Label under Global Parameters in the Properties Panel > View Tab. Each label will display one line of text, and user can add unlimited number of labels using multiple Text Labels.
Each label should be typed in as multiple "text" and "number" sections. Anything inside a pair of "{}" will be treated as a "number" section including the number to be displayed plus the corresponding display format; anything outside "{}" will be "text" sections and will be displayed as exactly what user typed in.
A text label typed as:
pressure = {101325%6g} [Pa]
will be displayed as:
pressure = 101325 [Pa]
Each "number" section has two parts: the number part followed by a display format separated by a "%" sign. The number itself can be a constant, or a variable accessible or user defined using the Expression Editor.
Format part also has two components: a "digit", and one of the "letters", "f" "e" "g" (or "F" "E" "G") for example "%4e". The "digit" controls how many significant digits of the number are to be displayed, and the "letter" determines the display format.
- Format "f" displays number in decimals, the "digit" in front of "f" indicates how many decimals are to be displayed. For example, "{12.375%2f}" will be displayed as "12.38"
- Format "e" displays number in scientific format with "e" as exponential. The "digit" is also how many decimals are to be displayed. For example, "{12.375%2e}" will be displayed as "1.24e+001". Note "{12.375%2E}" will be displayed as "1.24E+001".
- Format "g" is a self adjust format. The "digit" in this format is the total number of significant digits to be displayed. If the number is longer than the digits, it will automatically switch to scientific format. For example "{12.375%3g}" will be displayed as "12.4", but "{12375%3g}" will display as "1.24e+004" and "{12375%3G}" will display as "1.24E+004"
|
Note: The format part is optional. If no "letter" of format defined, "g" format will be used. And if no "digit" defined, it will display all the digits in the number. |
A few examples are shown below:
- Input "Time = {time} s" under Text Label in Global Parameters of View Tab. Here time in the brackets is a Global variable. This displays time of simulation in the Display Panel as shown in Figure 12.42.
- Font of text and color can be changed using Font and Color under Global Parameters in the View Tab. An example is shown in Figure 12.43.
- The total pressure on a boundary can be displayed in similar fashion using the following syntax under Text Label :
Total Pressure at outlet={flow.pt@outlet}[Pa].
|
|
|
Figure 12.44 - Text label-Expression |


To change transparency
- Choose any entity under the Geometric Entities Panel.
- Enable Surface in the Results Panel.
- Go to Properties Panel > View Tab, select Transparent for Transparency under Display Variable. A transparent volume is shown in Figure 12.47. Similarly, the volume can also be made Opaque, Translucent and User Defined (see Figure 12.45, Figure 12.46 & Figure 12.48).
|
|
|
|
|


To change color of surface
When a surface (Boundary /Volume /CAD Surface/Isosurface) is not colored by any variable, user can choose a solid color to display that surface.
- Choose desired Volume under the Geometric Entities Panel.
- Enable Surface in the Results Panel.
- Go to Properties Panel > View Tab, use Color under Display Variable, select the color from the Select Color dialog box (see, Figure 12.49), for the volume to be colored as shown in Figure 12.50. The default color is grey. Any color can be chosen to display a surface.
|
|
|


Save files
The graphics within the display window can be saved as image in different formats (PNG Image (*.png) and Animated GIF Image (*.gif)). The procedure for saving an image file is shown below:
- File > Save image
- Specify the File name, Save as type and click Save.

Figure 12.51 - Save images
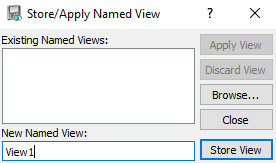
Save display settings
The settings of the Display Panel such as view angle, zoom factor, displayed surfaces, color of the displayed surfaces etc. can be saved for the future use. To save the view of the Display Panel:
The stored view can be used in two ways:
|
Figure 12.52 - View |