Add-on Components
Add-on components are a way to extend the basic functionality of Tecplot 360. They are executable modules designed to perform specific tasks. Many add-on components are available for loading data in various formats, implementing advanced editing, or extending the capabilities of Tecplot 360.
Add-on components are external programs connected to Tecplot 360 and can be accessed through the Tecplot 360 interface. When Tecplot 360 starts, it goes through several initialization phases, including processingtecplot.cfgfiles, loading Tecplot 360 stroke font files (tecplot.fnt), and graphics initialization. After completing these steps, Tecplot 360 searches for add-on components.
Loading Plugins
You can load add-on components using several methods: usingDrag-and-Drop Method, editingTecplot.add File, usingSpecifying Add-Ons on the Command Line, or throughSpecifying a Secondary Add-On Load File.
| Add-on components created for versions prior to Tecplot 360 2014 R1 will not be compatible with Tecplot 360 2025 R2. |
Drag-and-Drop Method
The simplest way to load a single-use add-on component is the drag-and-drop method. This method only loads the add-on component into the current Tecplot 360 session (not for every subsequent startup).
To use this method, locate the add-on component library file to be loaded in thebinsubdirectory of the Tecplot 360 installation directory. Select the library file, hold down the mouse button, drag it into the Tecplot 360 window, and release the mouse button to "drop" the add-on component. The add-on component will be loaded and available immediately.
This operation only loads the add-on component for the remainder of the current Tecplot 360 session. The next time you close and reopen Tecplot 360, you will need to reload the add-on component if you want to use it in the new session.
Tecplot.add File
Each time Tecplot 360 starts, it reads a file namedtecplot.addfrom the Tecplot 360 main directory and loads all add-on components specified in thistecplot.addfile.
The tecplot.addfile contains multiple$!LoadAddOncommands for loading add-on components into Tecplot 360. This special macro file only accepts$!LoadAddOnmacro commands, with the following syntax requirements:
$!LoadAddOn "libname"
In this example,libnameindicates the shared object library file name of a plugin. libname must be enclosed in quotation marks.
To unload a plugin (i.e., prevent Tecplot 360 from loading it at startup), add a hash sign ("#") before the corresponding line in thetecplot.addfile to comment it out. For example, the hash sign ("#") at the beginning of the following line will prevent the Auxiliary Data Editor plugin (libname "tecutiltools_editauxdata") from loading:
# $!LoadAddOn "tecutiltools_editauxdata"
To load a plugin that is not automatically loaded, remove the hash sign ("#") before the$!LoadAddOncommand that contains the libname of the plugin you wish to load. If the libname of the plugin you wish to load is not listed in the tecplot.add file, add a$!LoadAddOncommand followed by the libname of that plugin.
For information on loading the tecplot.add file, refer toCustom Files loaded on Startup.
Libname
Special rules specify how to define thelibnamename in thetecplot.addfile. In all cases, the file extension is omitted. If you specifylibnameas the base name of the shared object library, Tecplot 360 will perform the following actions:
- Linux
-
The shared library to be loaded will come from the file specified byInstall-Directory/lib/lib+basename.so.
- 指定的文件
-
Windowsbasename.dllTecplot 360 will search for plugins in the following directories in this order:
-
The directory containing the Tecplot 360 executable.
-
The Windows system directory.
-
Directories in your
PATHenvironment variable.
-
When using aV7ActiveXstyle plugin library on Windows, Tecplot 360 connects to the plugin via thelibnameentry in the registry.
If an absolute path name is usedlibname, on Windows platforms,.dllwill be appended; on Mac and Linux platforms,.sowill be appended.
Specifying Add-on Components on the Command Line
You can also instruct Tecplot 360 to load specific add-on components by including the following option when running Tecplot 360 from the command line:
-loadaddon <libname>
where <libname> is the full name of the add-on component (including path and extension),-loadaddonand if the file name uses the operating system's standard library extension, that part can be omitted (.dllfor Windows,.sofor Mac and Linux).
You can also load multiple add-on components from the command line.
After loading the add-on components, Tecplot 360 reprocesses all previously unprocessed command-line arguments (for graphics and add-on initialization). This allows data loader add-on components to be used to load data specified on the command line.
指定辅助附加加载文件
You can also instruct Tecplot 360 to load a different list of add-on components by specifying a secondary add-on load file using one of the following methods:
-
Include on the command line
-addonfileaddonfilename。 -
Set the environment variable
TECADDONFILE.
Both methods tell Tecplot 360 the name of the add-on load file to process (the file itself contains$!LoadAddoncommands). This auxiliary file will be processed after the main file.tecplot.add file.
随Tecplot 360版本附带的附加组件
Your Tecplot 360 installation includes the following add-on components listed alphabetically, which are detailed inWorking with Add-ons. Some of these are automatically loaded during installation; others require you to uncomment the corresponding lines in thetecplot.addfile (located in the Tecplot 360 main directory), or useAdd-on Loading.
其他在[T0000]中描述的加载方法。
使用附加组件Add-on Loading.
Advanced Quick Edit
The Advanced Quick Edit plugin (library nametecutiltools_advqet) loads automatically and displays"Advanced Quick Edit Tools" in the menu. This plugin allows you to quickly modify selected text and geometry objects in the current frame.
If this plugin is disabled and you wish to enable it, uncomment the$!LoadAddon "tecutiltools_advqet"line in theTecplot.add Filefile, or use other plugin loading methods described inAdd-on Loading.
.To use this plugin, select"Advanced Quick Edit Tools" from the menu to open the
dialog.The controls in the
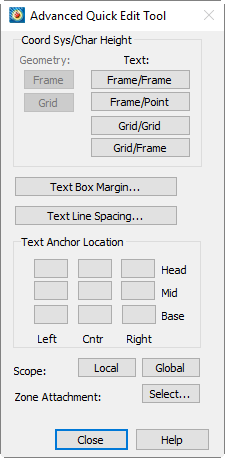
The dialog are only active when you have selected one or more text and/or geometry objects. Some controls apply only to text or geometry objects, while others apply to both. If the selected objects include a mix of text and geometry, controls that apply only to geometry will affect only the selected geometry objects; similarly, controls that apply only to text will affect only the text objects.
- The dialog includes the following options:
-
Geometry Coordinate SystemSwitch the selected geometry objects to frame coordinates or grid coordinates by selecting the corresponding button in the dialog
- area. Changing the coordinate system in this dialog adjusts the anchor position and size of each geometry object to maintain visual consistency in the plot.
-
Text Coordinate System and Character Height Units
- Change the position coordinate system and character height units of all selected text by selecting the corresponding button in the "Coordinate System/Character Height" area of the dialog. There are four valid combinations: [Frame/Frame], [Frame/Point], [Grid/Grid], and [Grid/Frame]. Changing the coordinate system in this dialog adjusts the anchor position and character height of each text object to maintain visual consistency in the plot.
-
Text Box Margin
- Use the [Text Box Margin] button to change the text box margin of all selected text.
-
Text Line Spacing
- Use the [Text Line Spacing] button to change the line spacing of all selected text.
-
Text Anchor Position
- Change the anchor position of all selected text by selecting an anchor from the nine-grid button set in the "Text Anchor Position" area of the dialog.
-
Change the scope of all selected text and geometry objects by selecting either [Local] or [Global] scope. Objects with local scope are displayed only in the frame where they were originally created. If objects are defined with global scope, they are displayed in all "like" frames, i.e., frames using the same dataset as the one in which the objects were created.
- Text and Geometry Object Zone or Map Association
-
Change the zone or map associated with the selected text or geometry objects by selecting Zone Association [Select]. This invokes对话框。When Tecplot 360 is in 2D or 3D Cartesian or Sketch plot type, this dialog lists zone names or numbers; when in XY Line plot type, it lists maps. The "<Unassociated Object>" option disassociates each selected text or geometry object from its zone or map.
Auxiliary Data Editor
The Auxiliary Data Editor add-on is automatically loaded with Tecplot 360. This add-on enables you to edit auxiliary data in Tecplot 360 and record the results to saved layout files.
If this add-on is disabled and you would like to enable it,$!LoadAddon "tecutiltools_editauxdata"
in your Tecplot.add Fileor use other methods for loading add-ons, as described inAdd-on Loading.
| Auxiliary data are name-value pairs associated with a dataset, frame, line map, page, variable, or zone, which Tecplot 360 stores as text strings. You canview all auxiliary data contained in the layout in the dialog (by going to). |
To use this add-on, from the menu to open the dialog.
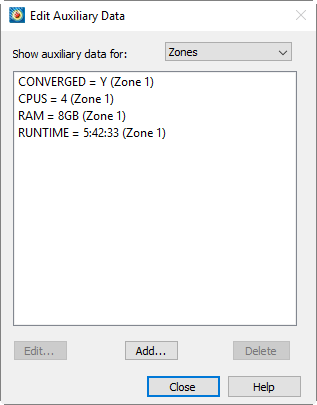
The The dialog contains the following controls:
- Show Auxiliary Data
-
In the drop-down menu at the top of the dialog, select the level for which you want to view, add, or delete auxiliary data. Options: Zone, Variable, Line Map, Active Frame, Active Page, Dataset, Layout, or All.
- Auxiliary Data Box
-
In the box in the middle of the dialog, all auxiliary data for the selected level are displayed. You can select any item in the box and edit or delete it using the [Edit] button or [Delete] button, respectively.
- Add Auxiliary Data
-
Using the [Add] button, you can add auxiliary data at any available location (zone, variable, etc.).
- Edit Auxiliary Data
-
Using the [Edit] button, you can edit any existing auxiliary data. First, select the item to edit in the auxiliary data box, then select the [Edit] button.
- Delete Auxiliary Data
-
Use the [Delete] button to delete any existing auxiliary data. Select the item to delete in the auxiliary data box, then select the [Delete] button.
You can view auxiliary data on the Auxiliary Data page of thedialog (by going to).
When saving a layout or packing a layout file after editing auxiliary data, Tecplot 360 records all added or edited auxiliary data into the layout and packed layout files.
Macro Commands
You can add auxiliary data using:$!EXTENDEDCOMMANDMacro commands, with the following syntax:
$!EXTENDEDCOMMAND
  COMMANDPROCESSORID = 'Aux Data Editor'
  COMMAND = '<operator> Name = <string> Value = <string> Location = <location> LocationIndex = <int>'
Where:
| Command Entity | Description |
|---|---|
<operator> |
Select one of the following: |
Name = <string> |
For <string>, start with an alphabetic character, followed by zero or more alphanumeric characters and underscores (no spaces) |
Value = <string> |
Only used with the following operators: |
Location = <location> |
For <location>, use one of the following: Zone, Var, Frame, Page, DataSet, LineMap, or Layout. |
LocationIndex = <int> |
For <int>, provide an integer value specifying which Zone, Var, Frame, or LineMap Tecplot 360 attaches the auxiliary data to. If adding auxiliary data to Page or DataSet, no LocationIndex is required. |
The following is an example macro command that adds an auxiliary data fragment named "TestID" with the value "Sequence 23, test 2" to the first zone.
$!EXTENDEDCOMMAND
  COMMANDPROCESSORID = 'Aux Data Editor'
  COMMAND = 'Add Name = TestID Value = "Sequence 23, test 2" Location = Zone LocationIndex = 1'
添加辅助数据
The The dialog allows you to add auxiliary data at multiple levels. To open this dialog, clickthe [Add] button in the dialog. Data added in thedialog will then be displayed in theauxiliary data display box of the dialog.对话框包含以下控件:
- Location
-
From the Location drop-down menu, select the level at which to add data. You can choose to add data at the region, variable, line plot, active frame, active page, layout, or dataset level.
- Number
-
When Location is set to Region, Variable, or Line Plot, the Number box is activated for you to specify the region number, variable number, or line plot number for adding auxiliary data.
- Name
-
Enter the name of the data in the Name box.
- 值
-
Enter the value of the data in the Value box.
Selectbutton to completethe operation of adding one piece of auxiliary data to the selected location in the dialog box.
Create Multiple Frames
Use the Create Multiple Frames plugin to generate a set of uniformly sized and spaced new frames within the active frame.
If this add-on is disabled and you would like to enable it,
uncomment the line $!LoadAddon "tecutiltools_mulframe"
in your Tecplot.add Fileor use one of the other methods to load addons describedAdd-on Loading.
要使用此插件,请在in the menu, select. This will open the dialog.
The dialog box, which contains the following options:
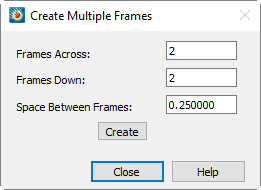
- Number of Horizontal Frames
-
Enter the number of frames displayed per row.
- Number of Vertical Frames
-
Enter the number of rows of frames.
- Frame Spacing
-
Enter the spacing displayed between frames in each direction, in paper ruler units.
Select the [Create] button to create multiple frames as specified.
See AlsoFrame CreationFor information on creating a single frame.
扩展宏
Extend Macro 插件(库名 "tecutilscript_extendmcr")扩展了 Tecplot 宏语言,增加了额外命令。若此插件已禁用且您希望启用,请取消注释该行:$!LoadAddon "tecutilscript_extendmcr"
in your Tecplot.add File or use one of the other methods to load addons described
in Add-on Loading.
您可以通过在宏文件中添加以下函数调用来使用 Extend Macro 插件:
$!EXTENDEDCOMMAND COMMANDPROCESSORID='extendmcr' COMMAND='command option'
该插件支持的命令如下表所示:
| 在 Extend Macro 命令中指定宏变量名称时,不应在变量名两侧添加竖线。例如,应使用 ZONENUM 而非 |ZONENUM|。 |
| 命令 | 说明 |
|---|---|
QUERY.ZONENAMEBYNUM nnn VVV |
获取区域名称字符串nnn并赋值给变量VVV. |
QUERY.VARNAMEBYNUM nnn VVV |
获取变量名称字符串nnn并赋值给变量VVV |
QUERY.ZONENUMBYNAME "zonename" VVV |
获取指定名称的区域编号zonename and assign to variable VVV |
QUERY.VARNUMBYASSIGNMENT assignment VVV |
通过赋值获取变量编号并赋值给变量VVV. VVV可具有以下任一值:
|
QUERY.DATASETTITLE VVV |
Get the dataset title string and assign it to the variable.VVV |
STRING.LENGTH StrSource VVV |
Get the length of the string. |
STRING.FINDPATTERN StrSource StrPattern VVV |
Get the sub-string, starting from |
STRING.SUBSTRING StrSource start end VVV |
获取子字符串,从 |
QUERY.ACTIVEZONES VVV |
Get the set of active zones and store the result intoVVV. |
QUERY.MAPNAMEBYNUM nnn VVV |
Return the string (map name) corresponding to the map numbernnnand store it into the variableVVV. The current active plot must be |
QUERY.ISADDONLOADED commandprocessorid VVV |
If the add-onVVVis loaded, incommandprocessoridOtherwise, return "NO" |
QUERY.FILEEXISTS "filename" VVV |
如果文件存在,VVV将被设置为 "YES",否则为 "NO"VVV将被设置为 "NO" |
QUERY.ISZONEACTIVE ZZZ VVV |
测试指定区域ZZZ是否处于激活状态。VVV则被设置为 "YES",否则被设置为 "NO" |
QUERY.LINEMAPZONEASSIGNMENT nnn VVV |
获取分配给线映射的区域编号nnn并将VVV. |
QUERY.ACTIVELINEMAPS VVV |
获取当前激活的线映射集合,并将结果存入VVV. |
QUERY.ISLINEMAPACTIVE nnn VVV |
测试线映射 nnn 是否处于激活状态。VVV则被设置为 "YES",VVV如果nnn ⇐0. |
FILE.APPENDSTRING "FileName" "String" |
将指定字符串追加到指定文件中,若文件不存在则创建该文件。FileName 可以是相对于 Tecplot 工作目录的相对路径,也可以是绝对路径。 |
FILE.APPENDLASTERROR "FileName" |
将最近一条错误消息(如有)追加到指定文件中,若文件不存在则创建该文件。FileName 可以是相对于 Tecplot 工作目录的相对路径,也可以是绝对路径。如果未发生任何 Tecplot 错误,此命令将不产生任何效果。 |
如果您已声明宏变量并希望将其与 Extend Macro 插件配合使用,可以通过将命令调用用单引号括起来、宏变量用双引号括起来的方式实现。
例如:
$!VarSet |ZoneName| = "Unknown"
$!EXTENDEDCOMMAND
  COMMANDPROCESSORID = "extendmcr"
  Command = 'query.zonenamebynum 1 "ZoneName"'
$!RemoveVar |ZoneName|
有关使用 Tecplot 360 宏语言的更多信息,请参阅脚本指南。
QUERY.DATASETTITLE
The following example usesQUERY.DATASETITLEthe command to place the title of the dataset at a specific location in the plot.
$!VARSET |ZNUM| = "blank"

$!EXTENDEDCOMMAND COMMANDPROCESSORID='extendmcr'
  COMMAND='QUERY.DATASETTITLE ZNUM'

$!ATTACHTEXT
  XYPOS
  {
    X = 5
    Y = 90
  }

  TEXT = "Title is: |ZNUM|"
QUERY.VARNAMEBYNUM
The following example uses QUERY.VARNAMEBYNUM to place the name of variable 2 at a specific location in the plot.
$!VARSET |VNAME| = "X"

$!EXTENDEDCOMMAND COMMANDPROCESSORID = 'extendmcr'
  COMMAND='QUERY.VARNAMEBYNUM 2 VNAME'

$!ATTACHTEXT
  XYPOS
  {
    X = 5
    Y = 85
  }

  TEXT = "Var 2 is: |VNAME|"
QUERY.ZONENAMEBYNUM
The following example uses QUERY.ZONENAMEBYNUM to place the title of zone 1 at a specific location in the plot. QUERY.ACTIVEZONES
$!VARSET |ZNAME| = "HELLO"

$!EXTENDEDCOMMAND COMMANDPROCESSORID = 'extendmcr'
  COMMAND='QUERY.ZONENAMEBYNUM 1 ZNAME'

$!ATTACHTEXT
  XYPOS
  {
    X = 5
    Y = 80
  }
  TEXT = "Zone is: |ZNAME|"
Query.ActiveRegion
The following example uses QUERY.ACTIVEZONES to display a list of active zones.
$!VARSET |ZNUMS| = "blank"

$!EXTENDEDCOMMAND COMMANDPROCESSORID='extendmcr'
  COMMAND='QUERY.ACTIVEZONES ZNUMS'

$!ATTACHTEXT
  XYPOS
  {
    X = 5
    Y = 70
  }
  TEXT = "Active zones are: |ZNUMS|"
For more information on using the Tecplot 360 macro language, refer to the Scripting Guide.
Extended Time Macro
The Extended Time Macro add-on simplifies the macro interface by allowing you to query the number of solution times in a dataset and advance the time step using simple loops. This differs from the native Tecplot macro language because it does not require you to know the solution times of the data.
This add-on uses a different algorithm for sorting solution times than Tecplot 360. Since Tecplot 360 merges time steps that are sufficiently close, the number of time steps reported by this add-on may differ from the number reported by Tecplot 360.
If this add-on is disabled and you would like to enable it,
uncomment the line $!LoadAddon "tecutilscript_extendtimemcr"
in your Tecplot.add File or use one of the other methods to load addons described
in Add-on Loading.
Macro Processing
The Extended Time Macro add-on can be called from the macro language using the following command:
This command retrieves the number of time steps. The number is returned to the macro variable VVV.
$!EXTENDEDCOMMAND COMMANDPROCESSORID='extend time mcr'
  COMMAND='QUERY.NUMTIMESTEPS VVV'
This command sets the solution time at time step nnn. Acceptable values for nnn range from: 1 - NumTimeSteps.
$!EXTENDEDCOMMAND COMMANDPROCESSORID='extend time mcr'
  COMMAND='SET.CURTIMESTEP nnn'
This command retrieves the solution time at time step nnn. The value is returned to the macro variable VVV.
$!EXTENDEDCOMMAND COMMANDPROCESSORID='extend time mcr'
  COMMAND='QUERY.TIMEATSTEP nnn VVV'
The following is an example loop using the Extended Time Macro add-on:
$!EXTENDEDCOMMAND COMMANDPROCESSORID='extend time mcr'
  COMMAND='QUERY.NUMTIMESTEPS NUMTIMESTEPS'
$!LOOP |NUMTIMESTEPS|
  $!EXTENDEDCOMMAND COMMANDPROCESSORID='extend time mcr'
    COMMAND='SET.CURTIMESTEP |LOOP|'
  $!EXTENDEDCOMMAND COMMANDPROCESSORID='extend time mcr'
    COMMAND='QUERY.TIMEATSTEP |LOOP| CURTIME'
  $!PAUSE "Current time is: |CURTIME|"
$!ENDLOOP
See also:Extract Over Time, Solution Time and Strand Editor, Extend Macro, Time Series, andTime Aware.
Extract Over Time
The Extract Over Time add-on extracts isosurfaces, streamtraces, and points from polyline geometry in transient data. The resulting zones are assembled into a new strand with the correct solution time set for each zone.
| When using this add-on, to save a layout file, you must also save the data file. |
If this add-on is disabled and you would like to enable it,
uncomment the line $!LoadAddon "tecutiltools_extractovertime"
in your Tecplot.add File or use one of the other methods to load addons described
in Add-on Loading.
To use this add-on, go toand select one of the following menu options.
- Extract Slice Over Time
-
This option has been moved to the Extract Slice dialog. SeeExtracting Slices to ZonesThe following macros are still available.
- Extract Polyline Over Time
-
Extracts polyline geometry into a zone for each solution time. It allows you to define the number of points to extract along the polyline. The requirements are as follows:
-
The frame must be in 2D or 3D.
-
Only a single polyline can be selected.
-
The data must be transient.
-
The polyline must lie over an existing zone.
-
- Extract Iso-Surface Over Time
-
Extracts iso-surfaces into zones for each solution time. The requirements are as follows:
-
The frame must be in 3D.
-
The frame must contain one or more iso-surfaces.
-
The data must be transient.
-
- Extract Streamtraces Over Time
-
Extracts a set of streamtraces into zones for each solution time. The requirements are as follows:
-
The frame must be in 2D or 3D.
-
The frame contains one or more streamtraces.
-
The data must be transient.
-
After extraction, the new line bundles are available and can be animated or saved to a file.
宏处理
The "Extract Over Time" add-on can be invoked using the following commands via the macro language:
| Extraction Type | Command |
|---|---|
Slice |
$!EXTENDEDCOMMAND COMMANDPROCESSORID='Extract Over Time' COMMAND='ExtractSliceOverTime' |
Iso-Surface |
$!EXTENDEDCOMMAND COMMANDPROCESSORID='Extract Over Time' COMMAND='ExtractIsoSurfaceOverTime' |
流线 |
$!EXTENDEDCOMMAND COMMANDPROCESSORID='Extract Over Time' COMMAND='ExtractStreamOverTime' |
几何图形 |
$!EXTENDEDCOMMAND COMMANDPROCESSORID='Extract Over Time' COMMAND='ExtractGeomOverTime' |
提取精确线条
提取精确线条插件(库名称:tecutiltools_extractpreciseline)允许您将线条上的点提取到新区域或 Tecplot ASCII 数据文件中。您需要指定线条起点和终点的精确 X、Y、Z 坐标,以及沿该线条提取的点数。
要使用提取精确线条插件,请选择.
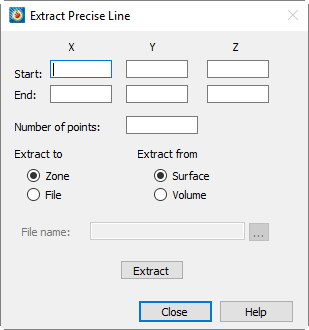
- 起点/终点 X/Y/Z
-
输入线条起点和终点的 X、Y、Z 坐标。
- 点数
-
起点与终点之间待提取的点数(起点和终点始终被提取,此数值不包含它们)。
- 提取至
-
选择提取到区域或文件。若提取到文件,还需在"文件名"字段中指定输出文件路径。
- 提取自
-
选择从线条穿过的表面还是体积进行提取。
在 3D 中从表面提取时,提取结果依赖于视图:指定线条从屏幕平面投影到被提取的表面上。更改视图(如旋转)将改变提取的点。
- 文件名
-
提取目标文件的路径。您可以手动输入路径、粘贴路径,或点击按钮打开"写入 Tecplot ASCII 文件"对话框进行交互式导航。
ClickPerform the extraction operation.
Extract Blanked Zones
The Extract Blanked Zones plugin (library name:tecutiltools_extractblankedzones) allows you to extract a subset of existing zones based on current blanking conditions. Once activated, the "Extract Blanked Zones" function will appear under the Data/Extract menu. To use it, simply set the blanking conditions (value blanking or IJK blanking), then select themenu option. Next, choose one or more zones to operate on. A new zone will be created for each selected zone (unless the blanking condition results in all cells and points of the entire zone being blanked).
Special handling for FE surfaces and volume regions containing isolated nodes.
Isolated nodes refer to nodes not connected to any elements in the finite element data. When value blanking is interactively enabled, these nodes are also processed. Isolated nodes can be viewed by setting the "Points to Plot" column to "All Nodes" in the "Point" tab of the Zone Style dialog.
When using the Extract Blanked Zones function, these nodes for surface and volume finite element data are not processed, so they will not become part of the generated zone.
Special handling for "linear" zones (i.e., I-ordered, J-ordered, K-ordered, or FE line segment zones).
Linear zones are handled specially: blanking is applied to points rather than cells. If the current plot is in 2D or 3D mode, this means ignoring the "Cell Blanking Condition" setting for current value blanking (i.e., the options below the "Blank entire cell when" option in the dialog). Elements in FE line segment zones are retained only if both endpoints of the element are not blanked. For I-ordered, J-ordered, and K-ordered zones, the resulting zone will maintain the same "ordered" type, but note that all resulting data points will be connected together, forming new "cells" that skip blanked points. Unlike FE surface zones, isolated points in linear FE line segment zones will be retained in the generated blanked zone.
For I-ordered, J-ordered, and K-ordered zones, cell-centered variables will be interpolated to nodes before extracting the blanked zone. FE line segment zones will retain the cell-centered values of non-blanked cells.
宏处理
The Extract Blanked Zones plugin can be invoked via the macro language using the following command:
$!EXTENDEDCOMMAND COMMANDPROCESSORID='EXTRACTBLANKEDZONES'
COMMAND='<commandoption>'
The command options are as follows:
| Command | Notes |
|---|---|
ZONES = <set> |
The ZONES option specifies the set of zones to operate on. |
Example:
Extract blanked zones from zones 1 and 5-9:
$!ExtendedCommand
  CommandProcessorID = 'EXTRACTBLANKEDZONES'
  Command = 'ZONES = [1,5-9]'
Keyframe Animator
With this plugin, you can easily create smooth transition animations through two or more specified views (keyframes) and export them as AVI, Flash, or raster metafile animations.
If this add-on is disabled and you would like to enable it,
uncomment the line $!LoadAddon "tecutiltools_keyframe"
in your Tecplot.add File or use one of the other methods to load addons described
in Add-on Loading.
To use this plugin, first create a layout and view the plot in 3D Cartesian mode. Then select "Keyframe Animation". menu to open the dialog.
| You must be in 3D Cartesian mode to use the Keyframe Animator plugin. |
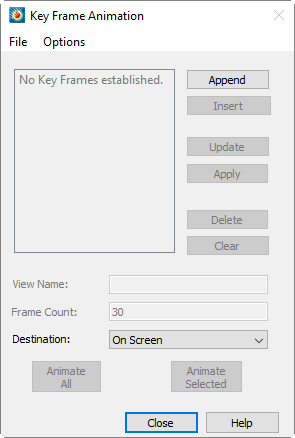
要使用此对话框创建关键帧动画,请遵循以下一般步骤:
-
将绘图旋转和/或缩放到动画的初始视图,然后选择对话框中的[Append]按钮。如果需要,您可以通过在关键帧框中选择帧("View 1")并在对话框的视图名称字段中编辑名称(例如"翼型末端")来更改视图(关键帧)的名称。
-
将绘图旋转和/或缩放到您希望动画包含的下一个视图,然后选择[Append]按钮将该视图添加到动画末尾。或者您可以选择[Insert]按钮在列表中所选视图上方插入一个视图。这些关键帧是Tecplot 360中视图的快照,因此关键帧之间的旋转角度应限制在180度或更少,否则动画可能不会按预期旋转。
-
根据需要继续旋转和/或缩放,并选择[Append]或[Insert]以添加更多关键帧到动画中。
-
完成关键帧添加后,选择[Animate All]以执行所有视图的完整动画,或选择[Animate Selected]仅对关键帧框中选定的视图进行动画。Tecplot 360将插值所有视图之间的中间视图以创建动画。
-
要导出动画,将目标从"Screen Display"更改为"Output to File"。然后选择[Animate All]或[Animate Selected]以打开对话框。您可以选择将文件导出为AVI、Flash或光栅图元文件。有关导出文件的详细信息,请参阅。Exporting Plots有关导出文件的详细信息,请参阅。
The 对话框包含以下控件:
- Append
-
[Append] 按钮将活动帧中的当前视图添加到列表中。
- Insert
-
使用 [Insert] 按钮将当前视图插入到关键帧列表中当前选中视图的上方。
- Update
-
[Update] 按钮将列表中选中的视图替换为 Tecplot 360 中的当前视图。同时会重新捕获当前求解时间。
- Apply
-
使用 [Apply] 按钮将选中的视图显示为绘图的当前视图。
- Delete
-
选择 [Delete] 按钮从列表中删除选中的关键帧。
- Clear
-
使用 [Clear] 按钮将从列表中删除所有关键帧。
- View Name
-
使用 View Name 字段重命名关键帧列表中选中的视图。默认情况下,Tecplot 360 将视图命名为 "View 1"、"View 2" 等。
- Frame Count
-
Frame Count 框设置 Tecplot 360 在动画中选中视图与下一个视图之间绘制的帧数。
- Target
-
In the Destination dropdown menu, select whether to display the keyframe animation on the screen or output it to a file.
- Animate All
-
Select [Animate All] to play the animation of all keyframes in the list.
- Animate Selected
-
Select [Animate Selected] to play the animation of only the selected views. This allows you to refine a subset of the animation without executing the full animation.
Animation Customization
The Key Frame Animator plugin provides additional functionality for customizing animations.andThe menus are located at the top of the Keyframe Animation dialog. These menus provide the following additional options:
- Through File→Open/Save Animation
-
In the menu, you can save the created animation or open a previously saved animation. The animation file stores settings and all keyframes, with the default file name beinganimation.keyframe. The ability to save and load animation files allows you to manage created animations without having to recreate them.
- Options
-
In the In the menu, except for "Time Animation Options" (which opens theTime Animation Optionsdialog), each option is a toggle switch. Select an option from this menu to enable the corresponding preference. When an option is enabled, a check mark appears next to it.menu.
- Animate Time Concurrently
-
Select this option to animate time concurrently with the animation keyframes, as specified in the "Time Animation Options" dialog.
- Animate Streamtraces Concurrently
-
If streamtraces are displayed as markers or dashed lines in the plot, enable "Animate Streamtraces Concurrently" to synchronize the movement of streamtrace markers or dashes with the keyframe animation.
- Fade In/Fade Out
-
Enable "Fade In" and/or "Fade Out" to fade the light intensity and background light in and/or out at the beginning and/or end of the keyframe animation. The fade effect lasts for 30 frames or the first 10% of the total number of frames (whichever is shorter). The fade function works best on a black background and without plot features that are not light-sensitive (such as grid lines, edge lines, etc.).
Time Animation Options
ThroughDialog (open viaselecting "Time Animation Options" from the menu), you can specify additional options for keyframe animation. Choose one of the following methods to animate frames:
- Forward
-
Selecting "Forward" causes Tecplot 360 to display the earliest solution time in the first keyframe and progressively advance the solution time during the keyframe animation, so that the last frame shows the latest solution time.
- Loop
-
Selecting "Loop" advances the solution time in the same way as the "Forward" option, but the complete solution time cycle is displayed multiple times within one keyframe animation cycle. Set the number of solution time cycles to display in the "Num Cycles" box.
- Bounce
-
Selecting "Bounce" advances the solution time forward during the animation until one solution time cycle is completed. Then the solution time decreases at equal intervals until the initial solution time is displayed. Specify the number of times this bounce repeats in the "Num Cycles" box.
- By Capture State
-
Selecting "By Capture State" associates each keyframe with the solution time displayed in that frame when it was added to the keyframe list. During keyframe animation, the solution time changes at equal intervals between consecutive keyframe pairs, so that each keyframe displays its associated solution time.
See Also: Key Frame Animator.
Export Animation Options
In the dialog, when animating a set of keyframes, you can export the animation by selecting "Output to File" from the "Target" dropdown menu. Then choose "Animate All" or "Animate Selected" to launch thedialog. In this dialog, you can customize the export settings for the animation. Then selectto choose the file location and export the animation.
The The dialog contains the following animation export settings:
- Format
-
Select the format for the exported file.
- Region
-
Select the portion of the workspace to export. You can export the active frame, all frames, or the entire workspace.
- Width
-
Select the width of the exported animation. You can use the default width of the screen image or enter a custom size.
- Animation Speed
-
Enter a number representing the animation playback speed in frames per second.
- Anti-aliasing
-
Enable "Anti-aliasing" to use anti-aliasing in the exported animation. For more information on anti-aliasing, please refer toAntialiasing Images.
- 图像类型
-
如果导出为Flash格式,请选择动画所基于的图像类型。
- 优化
-
通过对话框底部的两个优化选项,您可以选择优化动画以获得更快的速度或更小的文件大小。
宏处理
要从宏语言调用关键帧动画器,请使用以下命令:
保存动画文件:
$!EXTENDEDCOMMAND
  COMMANDPROCESSORID = 'Key Frame Animation'
  COMMAND = 'Animate AnimationDestination=<animationdest>'
在此命令中,请使用OnScreen或ToFile作为<animationdest>参数。
打开动画设置文件:
$!EXTENDEDCOMMAND
  COMMANDPROCESSORID = 'Key Frame Animation'
  COMMAND = 'OpenSettingsFile FileName = <string>'
保存动画设置文件:
$!EXTENDEDCOMMAND
  COMMANDPROCESSORID = 'Key Frame Animation'
  COMMAND = 'SaveSettingsFile FileName = <string>'
使用$!ExportSetup命令设置导出文件所需的参数(即设置格式、文件名等)
请注意,$!ExportSetup参数EXPORTFNAME用于控制导出文件名,可接受内置宏变量,例如SOLUTIONTIME, FRAMENAME, and LAYOUTFNAME。.png图像,该图像会追踪其来源的帧名称和求解时间,则当提供的内置变量存在时,以下宏命令有效:
$!EXPORTSETUP EXPORTFNAME = 'path/to/output/directory/|FRAMENAME|-|SOLUTIONTIME|.png'See Also: Key Frame Animator.
测量距离
测量距离插件在Tools下拉菜单中提供两个菜单项,仅适用于3D和2D笛卡尔图。
If this add-on is disabled and you would like to enable it,
uncomment the line $!LoadAddon "tecutiltools_measuredistance"
in your Tecplot.add File或使用其他方法加载插件,详见Add-on Loading.
Tools菜单项包括:
- 测量距离
-
从Tools菜单中选择此命令,然后在图上点击两个点。第二次点击后,将弹出一个对话框,显示两点的坐标、坐标差值以及两点间的直线距离。
在三维空间中,测量的距离是所选不同点之间的最短距离,不沿曲面计算。在二维空间中,距离在2D平面内计算。
- 测量角度
-
从Tools菜单中选择此命令,然后在图上点击三个点。第三次点击后,将弹出一个对话框,显示点1到点2的距离、点2到点3的距离,以及以弧度和度为单位的角度。
在三维空间中,测量的角度是向量1-2和向量2-3在由点1、2、3定义的平面内的夹角。在二维空间中,角度在2D平面内计算。
多帧三维
The multi-frame 3D plugin adds two menu items to the Frame dropdown menu: Tile Frames and 3D Multi-Frames. Each command displays a small dialog box providing options for managing frames in the plot.
If this plugin is not enabled and you wish to enable it, uncomment the following line:$!LoadAddon "tecutiltools_multiframe3d"
in your Tecplot.add File or use one of the other methods to load addons described
in Add-on Loading.
Tiled Frames
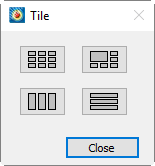
The Tile Frames dialog allows you to quickly arrange multiple frames on the page in various layouts. In clockwise order from the top-left corner, the layouts include:
- Square
-
Frames are as close to square as possible and arranged in a grid with roughly equal numbers of rows and columns.
- Wrap arrangement
-
The main frame is displayed at a larger size, with the remaining frames wrapped around its right and bottom sides. The size of the main frame depends on the number of additional frames that need to be wrapped around the page.
- Horizontal arrangement
-
Equal-sized horizontal frames are stacked vertically.
- Vertical arrangement
-
Equal-sized vertical frames are arranged horizontally.
When resizing frames, no attempt is made to refit the data. If the aspect ratio of a frame changes, the data may not fit the frame as well as before tiling.
3D Multi-Frame
The 3D Multi-Frame dialog is available only when the active frame is in 3D Cartesian mode. This dialog creates three additional frames displaying the top view (XY), front view (XZ), and side view (YZ) of the 3D frame.
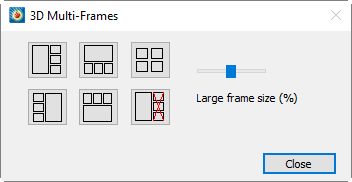
You can choose from five arrangements. Four of them use a large frame to display the original 3D frame and place the top, front, and side views at the top, bottom, or sides of the large frame. For these views, a slider sets the large frame size to 25% to 75% of the paper area. A grid arrangement is also provided, giving equal weight to all four frames. A button with a red X is used to delete the auxiliary frames (they can also be deleted manually).
When creating new frames, the data and style are shared with the original frame, and the new views automatically fit their frames. The program also links layer toggles (such as mesh, contours, lighting, etc.), so changes in one frame are automatically reflected in the others.
宏处理
To tile frames using the Tecplot macro language, use the following command.
$!EXTENDEDCOMMAND
  COMMANDPROCESSORID = 'Multi Frame Manager'
  COMMAND = 'TILEFRAMESSQUARE'
The command can be TILEFRAMESSQUARE, TILEFRAMESVERT, TILEFRAMEZHORIZ, or TILEFRAMESWRAP.
To generate top/front/side view frames from a 3D view, use the following command.
$!EXTENDEDCOMMAND
  COMMANDPROCESSORID = 'Multi Frame Manager'
  COMMAND = 'MAKEFRAMES3D ARRANGE=LEFT SIZE=25'
The ARRANGE parameter can be LEFT, TOP, RIGHT, BOTTOM, or TILE. The first four methods accept a SIZE parameter, representing a percentage of the paper size, ranging from 25 to 75.
To delete the top/front/side view frames, use the following command.
$!EXTENDEDCOMMAND
  COMMANDPROCESSORID = 'Multi Frame Manager'
  COMMAND = 'DELETEFRAMES3D'
Solution Time and Time Series Editor
The Solution Time and Time Series Editor plugin allows you to modify time series and solution time values through the user interface. This is particularly useful when loading a series of data files that do not contain solution times or time series IDs. Adding solution times simplifies animation creation and component style settings.
If this add-on is disabled and you would like to enable it,
uncomment the line $!LoadAddon "tecutiltools_strandeditor"
in your Tecplot.add File or use one of the other methods to load addons described
in Add-on Loading.
To access this plugin, select从Menu. The dialog contains the following options:
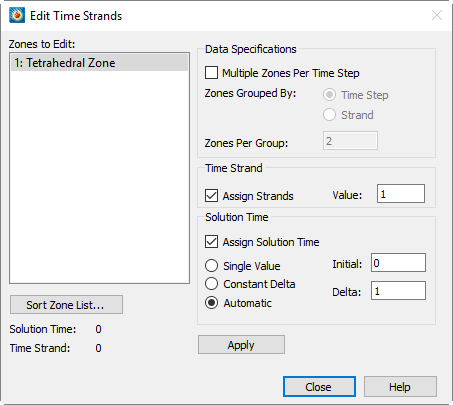
- Zones to Edit
-
In the "Zones to Edit" box, select a set of zones to edit.
- Data Specification
-
Enable "Multiple Zones per Time Step" to group zones by time step or time series. Use the "Data Specification" area in the dialog to specify how the plugin groups zones.
- Strand ID
-
In the "Time Strand" area of the dialog, enable "Assign Strands" to assign Strand IDs.
- Solution Time
-
In the "Solution Time" area of the dialog, enable "Assign Solution Time" and use one of the following options to assign solution time:
- Single Value
-
The "Single Value" option assigns the specified solution time to all selected zones.
- Constant Delta
-
The "Constant Delta" option applies a constant increment between zones (or groups of zones, depending on the Data Specification setting).
- Automatic
-
The "Automatic" option attempts to determine the solution time for each zone in the following order:
-
Check for Common.Time auxiliary data attached to the zone.
-
Attempt to read a number from the zone name.
-
Attempt to find a dataset variable containing time values. If found, use the minimum value of that variable in the zone.
-
If an existing solution time is already defined for the zone, the "Automatic" option uses that value.
-
If all of the above attempts fail, the "Automatic" option falls back to using the "Constant Delta" option.
-
Tensor Eigensystem
The Tensor Eigensystem enables you to compute eigenvalues and eigenvectors of a 3x3 symmetric tensor whose components are stored in your dataset. The plugin performs the computation for each node in the dataset and stores the results as new dataset variables.
If this add-on is disabled and you would like to enable it,
uncomment the line $!LoadAddon "tecutiltools_tensoregn"
in your Tecplot.add File or use one of the other methods to load addons described
in Add-on Loading.
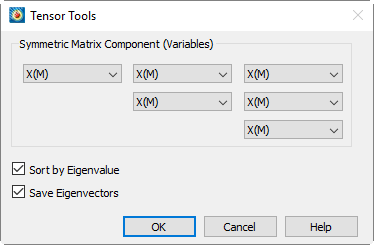
要使用此插件,请从 menu to open the dialog.
In the Select "Tensor Eigensystem" in the dialog, then select variables from the dataset to represent the six components of the tensor. Enable "Sort by Eigenvalue" to sort results by eigenvalue, and/or enable "Save Eigenvectors" to store the computed eigenvectors (in addition to eigenvalues, which are always saved). Then selectExecute the computation.
Tecplot 360 stores the eigenvalues of the tensor as variables EgnVal1, EgnVal2, and EgnVal3 in the dataset. If you choose to also save eigenvectors, they are stored as variables EgnVec11 through EgnVec33. If you enable "Sort by Eigenvalue", the eigenvalues and their corresponding eigenvectors are sorted from largest to smallest at each grid node. The correspondence between eigenvalues and eigenvectors is as follows:
EigVal1 → EgnVec11, EgnVec21, EgnVec31
EigVal2 → EgnVec12, EgnVec22, EgnVec32
EigVal3 → EgnVec13, EgnVec23, EgnVec33
Tensor Eigensystem的一个常见用途是可视化流场解中的涡核。您可以通过以下方法实现:
-
计算速度梯度
-
计算对称张量 S² + Ω²(参见下方用于执行此操作的方程文件)
-
使用用于计算排序后特征值的对话框
-
显示 Lambda-2 的等值面,该值为三个特征值中的中间值,在涡核附近为负值
以下方程文件用于从步骤2中的速度梯度计算所需的 S² + Ω² 对称张量分量。将下方内容保存为文本文件,然后通过选择"Load Equations"并选中该文件将其加载到对话框中
#!MC 1100
$!ALTERDATA EQUATION = '{s11} = {dUdX}'
$!ALTERDATA EQUATION = '{s12} = 0.5*({dUdY}+{dVdX})'
$!ALTERDATA EQUATION = '{s13} = 0.5*({dUdZ}+{dWdX})'
$!ALTERDATA EQUATION = '{s22} = {dVdY}'
$!ALTERDATA EQUATION = '{s23} = 0.5*({dVdZ}+{dWdY})'
$!ALTERDATA EQUATION = '{s33} = {dWdZ}'
$!ALTERDATA EQUATION = '{Omga12} = 0.5*({dUdY}-{dVdX})'
$!ALTERDATA EQUATION = '{Omga13} = 0.5*({dUdZ}-{dWdX})'
$!ALTERDATA EQUATION = '{Omga23} = 0.5*({dVdZ}-{dWdY})'
$!ALTERDATA EQUATION = '{s2o2_11} = {s11}**2 + {s12}**2 + {s13}**2 - {Omga12}**2 - {Omga13}**2'
$!ALTERDATA EQUATION = '{s2o2_12} = {s11}*{s12} + {s12}*{s22} + {s13}*{s23} - {Omga13}*{Omga23}'
$!ALTERDATA EQUATION = '{s2o2_13} = {s11}*{s13} + {s12}*{s23} + {s13}*{s33} + {Omga12}*{Omga23}'
$!ALTERDATA EQUATION = '{s2o2_22} = {s12}**2 + {s22}**2 + {s23}**2 - {Omga12}**2 - {Omga23}**2'
$!ALTERDATA EQUATION = '{s2o2_23} = {s12}*{s13} + {s22}*{s23} + {s23}*{s33} - {Omga12}*{Omga13}'
$!ALTERDATA EQUATION = '{s2o2_33} = {s13}**2 + {s23}**2 + {s33}**2 - {Omga13}**2 - {Omga23}**2'
| 请注意,张量特征系统插件仅能分析3×3对称张量(不能分析2×2、反对称或非对称张量) |
宏处理
要使用宏调用张量特征系统插件,请使用以下语法
$!EXTENDEDCOMMAND
  COMMANDPROCESSORID = 'Tensor Eigensystem'
  COMMAND = 'T11VarNum = <varref>\nT12VarNum = <varref>\nT13VarNum =
             <varref>\nT22VarNum = <varref>\nT23VarNum = <varref>\nT33VarNum =
             <varref>\nSortEgnV = <Boolean>\nSaveEgnVect = <Boolean>'
其中 <varref> 可以是整数或包含在双引号中的变量名
时间序列
时间序列插件可提取单个点随时间的变化,并在新帧中以XY线图形式绘制结果。时间序列图帧的解算时间与其父帧关联,并添加标记网格线以显示当前解算时间。若执行最近点探测(使用Control-click),您可以追踪特定节点随时间的变化,或追踪XY(Z)位置的变化
If this add-on is disabled and you would like to enable it,
uncomment the line $!LoadAddon "tecutiltools_timeseries"
in your Tecplot.add File或使用中描述的其他方法加载插件Add-on Loading.
|
在追踪节点随时间变化时,每个区域必须具有相同的节点映射(或共享节点映射) 当同一解算时间下同一链中有多个区域时,此插件可能无法按预期工作 若用户探测随时间改变位置的三维网格,最终图中可能出现跳过的值。此时使用最近点探测(Control-click)可能获得更佳结果 |
要使用时间序列插件,请从菜单中选择以下选项之一菜单:
- 探测以创建时间序列图
-
此选项将鼠标模式设置为探测。您可以使用鼠标或Dialog probe point. The probe location will be sampled over time (for transient data) and generate corresponding XY line plots. If performing nearest point probing (Control-click), a dialog will pop up asking whether to track the node or XY(Z) position over time. If tracking the node, ensure that each zone in the data has the same node mapping over time.
- Send time series data to new frame
-
This option creates a new frame for each extracted point. By default, frames used for time series data are reused to avoid creating too many frames.
See also: Extract Over Time, Extend Time Macro, Solution Time and Strand Editor, Extend Macro, and Time Aware.
Write data to formatted text
The "Write data to formatted text" plugin enables you to write data from XY line plots to a text file.*.csvFormat (for comma-separated data) or*.txtFormat (for other data delimiters).
If this add-on is disabled and you would like to enable it,
uncomment the line $!LoadAddon "tecutildataio_excsv"
in your Tecplot.add File or use one of the other methods to load addons described
in Add-on Loading。Select "Write data to formatted text" from the menu. dialog.
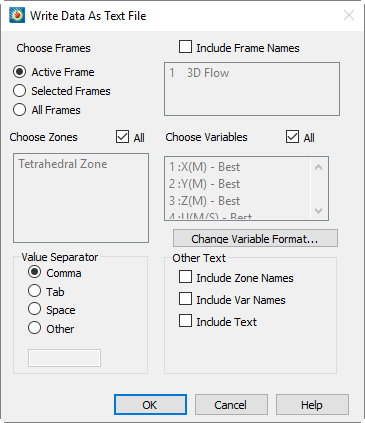
The The dialog includes the following options:
- Select frames
-
Use the "Select frames" area in the dialog to specify which frames to include in the text file. Choose from the following options:
- Active frame
-
Select this option to include only the active frame.
- Selected frames
-
When "Selected frames" is active, the box on the right becomes available. Use Shift and Control keys to select multiple items in the list.
- All frames
-
Select "All frames" to include data from all frames in the text file.
- Select zones
-
Turn off the "All" option to select a subset of zones to include in the text file. Since different frames may have different zones, this option is only available when "Active frame" is selected in the "Select frames" area of the dialog.
- Select variables
-
Turn off the "All" option to select a subset of variables to include in the text file. Since different frames may have different variables, this option is only available when "Current frame" is selected in the "Select frames" area of the dialog.
- Value delimiter
-
Use the "Value delimiter" option to specify the delimiter used in the text file.
- Change variable format
-
Click to launchChange Format对话框。如果选择不更改变量格式,则值将以“最佳”格式写入,但名为“Time”或“Date”的变量除外。
- 其他文本
-
打开对话框中“其他文本”区域中的任意选项,以在文本文件中包含所需的值。
更改格式
Use the 对话框(可通过“将数据写入为文本文件”对话框中的“更改变量格式”按钮访问)用于更改一个或多个变量的格式。要同时更改所有变量的格式,请打开.
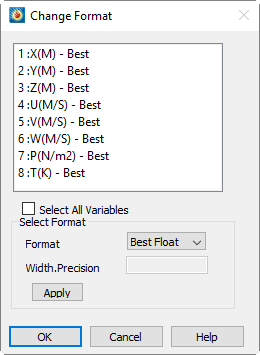
在对话框的"选择格式"部分选择新格式。可用格式包括"最佳浮点数"、"整数"、"浮点数"和"指数"。"最佳浮点数"会根据数值自动选择常规浮点表示法或科学记数法,并使用尽可能多的位数来表示该值。"浮点数"和"指数"分别使用标准记数法和科学记数法。
选择"浮点数"或"指数"后,可使用"宽度.精度"框,通过C风格数值格式说明符(参见以下示例)指定新变量格式的宽度和精度。宽度指总字符数(包括小数点;必要时数字左侧会填充空格),精度指小数点后的位数。精度为硬性限制,宽度为软性限制:始终使用指定的精度位数,但若数字超出指定宽度则不会被截断(参见以下第二个示例)。前导零不显示,但紧邻小数点前的零除外(即介于-1和1之间的数值)。
例如,一个Width.Precision的10.2结果为:
Month,Seattle Rainfall,Dallas Rainfall,Miami Rainfall,Error 1,
1.00, 4.30, 4.00, 4.00, 0.20,
2.00, 4.50, 4.00, 4.10, 0.22,
3.00, 4.00, 3.50, 4.50, 0.24,
4.00, 4.20, 3.40, 4.20, 0.24,
而一个Width.Precision of 3.2 yields:
Month,Seattle Rainfall,Dallas Rainfall,Miami Rainfall,Error 1,
1.00,4.30,4.00,4.00,0.20,
2.00,4.50,4.00,4.10,0.22,
3.00,4.00,3.50,4.50,0.24,
4.00,4.20,3.40,4.20,0.24,